Social Wall
  Feed Analytics

Your social media feed has been on your homepage for six months. Posts arrive on their own, the layout looks right, and as far as anyone can tell, it is doing its job.
The catch is that nobody could tell you for sure. Not how many people stopped to look at it, and not whether the reviews feeds on your pricing page gets read.
Smash Balloon Feed Analytics Pro 2.0.0 is where those answers live now.
If you have not come across it before, Feed Analytics Pro is a companion plugin that adds a dashboard to the Smash Balloon feed plugins you already run, and counts what visitors do with the feeds you have already built. No extra login, no separate app, nothing to configure feed by feed.
Feed Analytics comes included with the All Access Bundle, and with any Elite license on any single Smash Balloon plugin, at no extra cost on top of what you already pay.
Here is what you can do starting today:
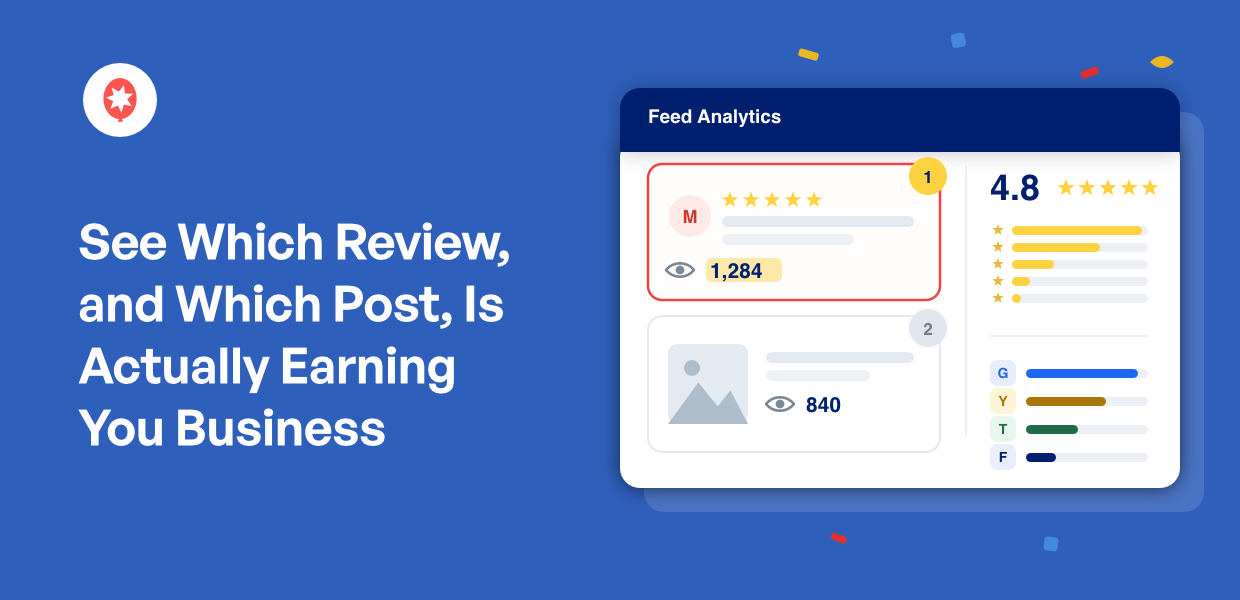
- See your rating, your star spread, and whether your reviews still look current, without opening Google or Yelp
- Find out which testimonial on your pricing page gets read and which gets scrolled past
- Check which of your sources, Google, Yelp, Trustpilot, Facebook, is actually carrying you
- Follow visitors from landing on the page to opening your Instagram, and see where they stop
- Pull up just TikTok, or just Reviews, in one click
- Export your numbers to drop into your own client reports
Two things changed in version 2.0, and which one matters more depends on what you run.
If you use Smash Balloon Reviews Feed, the big one is a new Reviews report, and we’ll talk about that in the next section below.
If you do not, skip to the part that works on every social feed, whether that is Instagram, Facebook, YouTube, X (Twitter) or TikTok.
See Where Your Reputation Stands Without Opening Google or Yelp
Reviews Feed is our plugin for putting your Google, Yelp, Trustpilot, Facebook and WooCommerce reviews on your own pages.
In the past, checking how that reputation is doing has meant opening each of those platforms in turn. Now, the Reviews Report puts it on one screen inside WordPress.
One thing to do first: update Reviews Feed to 2.13.0 or newer. That is the version that starts sending your review data across to Feed Analytics, and it is free on both the free and Pro versions of Reviews Feed.
See What Makes Up Your Star Rating
Your average is one number. The Reputation card breaks it down into what share of your reviews sit at 5 stars, 4 stars, 3 stars and below, which is closer to what a visitor takes in when they scroll your feed.
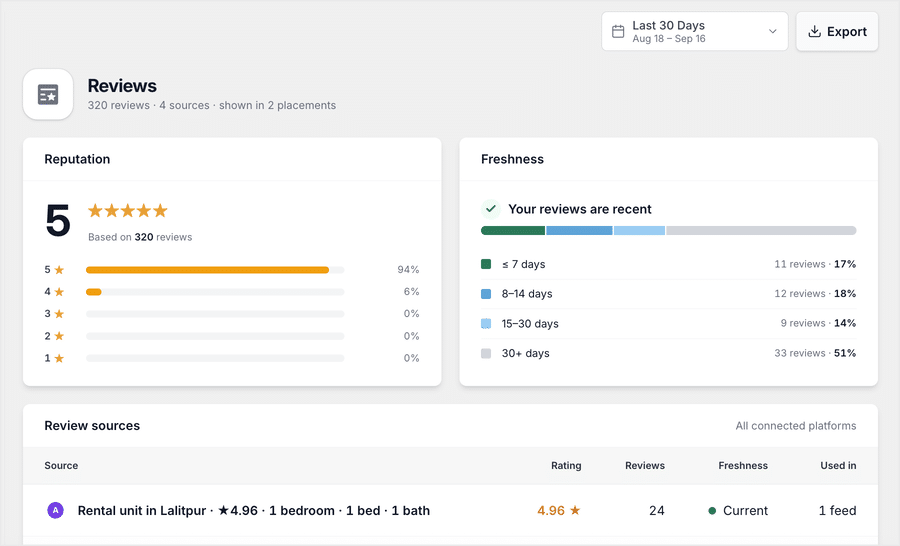
Two businesses can both sit at 4.6, one on steady 4s and 5s, the other on mostly 5s with a cluster of 1-star reviews underneath.
- A dental practice sitting at 4.7 finds six 1-star reviews behind it, all from one rough month two years ago, so it sets the feed to show 4 stars and up
- A WooCommerce store sees 5-star reviews outnumbering everything else nine to one, so it turns the rating filter off and shows every review it has
- A photographer checks the breakdown before adding a feed to a pricing page, so nothing unexpected turns up next to the prices
See Whether Your Reviews Still Look Recent
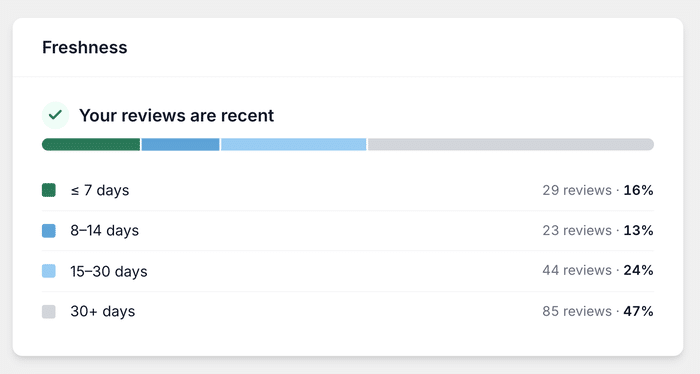
Someone reading your reviews usually glances at the dates first. The Freshness card sorts your reviews into four age groups, from the last 7 days out to 30+ days, and tells you in plain words whether your reviews look recent.
- If half your reviews sit in the 30+ days group and the last 7 days is empty, that shows up immediately, and a quick ask at the counter is usually all it takes to start turning it around
- Nothing new in the last two weeks after a busy month before it? A review link in your follow-up email usually closes that gap
- Checking in February leaves a garden center enough runway to collect fresh reviews before the spring rush
See Which Sources Your Reviews Come From
The Sources table lists every platform you have connected, with how many reviews each one has brought in, how recent they are, and how many of your feeds use it.
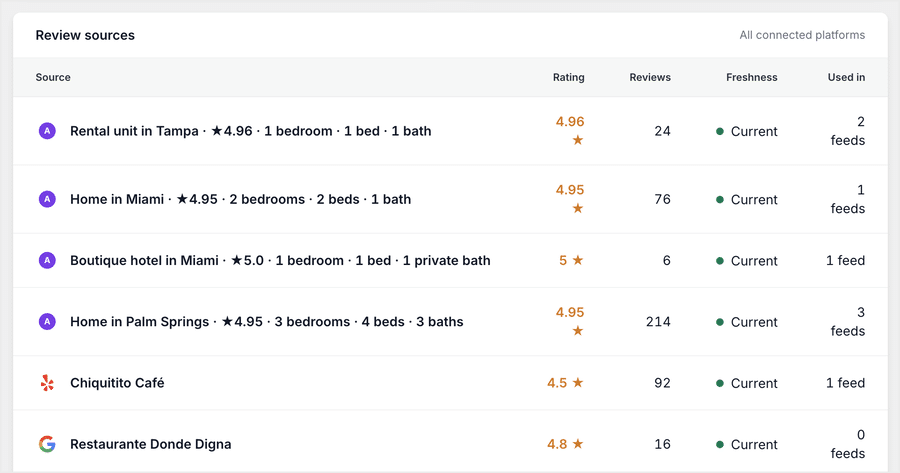
Most sites lean on one source far more heavily than they realize.
If almost all of your reviews turn out to be Google, as they do for plenty of local trades, asking customers for a Facebook review too spreads that risk.
The table also shows which sources are still active. A hotel running Google, TripAdvisor, and Booking.com might find TripAdvisor is the only one bringing in anything recent, and move it above the others on the rooms page.
And that Easy Digital Downloads source you connected back in spring? This is where you notice it only feeds one quiet page, and put it on the checkout instead.
See Every Page Your Reviews Appear On
The Feeds table gives you a row for each feed you have built, and opening a row lists the pages that feed appears on.
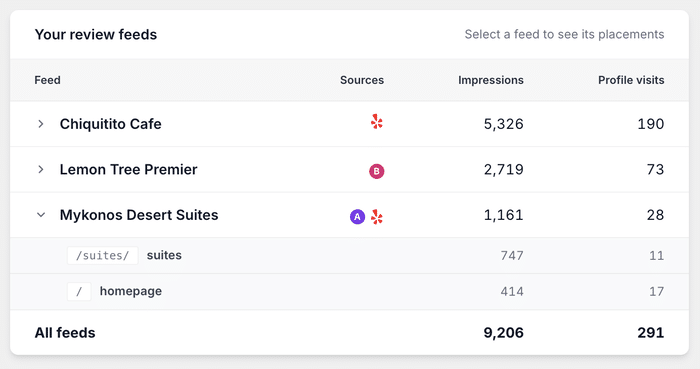
Once a site grows past a dozen pages, that is genuinely hard to keep track of in your head.
Check your own checkout and you may find there is no review feed on it at all, which is a five-minute fix on the page where hesitation tends to peak.
If you’re an agency taking over a client site, you get the full list of placements without clicking through forty pages to build it.
See Which Review People Actually Read
You picked the testimonial at the top of your pricing page for good reason.
What you could not see is how visitors respond to it, and the one that reads best is not always the one that gets read.
Click any review in the Recent reviews list, and you get its read rate, the share of people who saw it and actually read it, plus how it compares to the rest of that feed.
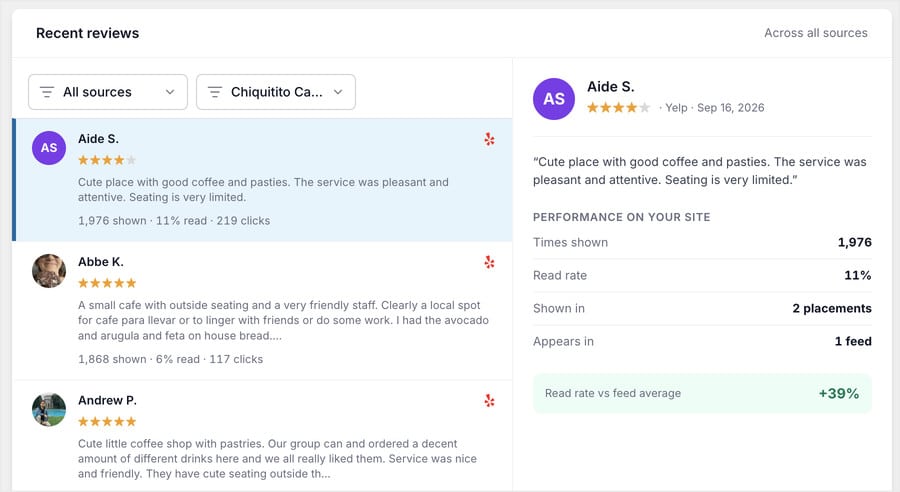
That is usually enough to tell you what belongs where.
Say the top of your pricing page carries a long, thoughtful Google review about how smooth your onboarding was. A few rows down sits a blunt one: “Setup took ten minutes and I was done.” If the short one has the higher read rate, that is the review to lead with.
It works the other way too. A review that names a specific worry, something like “I hesitated at the price until I saw how much time it saved me,” often outreads a general five-star rave, because it answers the exact thing your visitor is stuck on.
And once you can see which phrases your customers keep reaching for, “no coding needed,” “worth every penny for the support,” you can lift that wording straight into the headline on the page.
Find out which review is doing the selling
Feed Analytics Pro shows the read rate on every review, so you know which one belongs at the top of your pricing page. Comes with any Elite license or the All Access Bundle, backed by a 14-day money back guarantee.
See My Review Read RatesFollow Visitors From the Page to Your Profile
Everything from here down works on every feed you run, reviews or not.
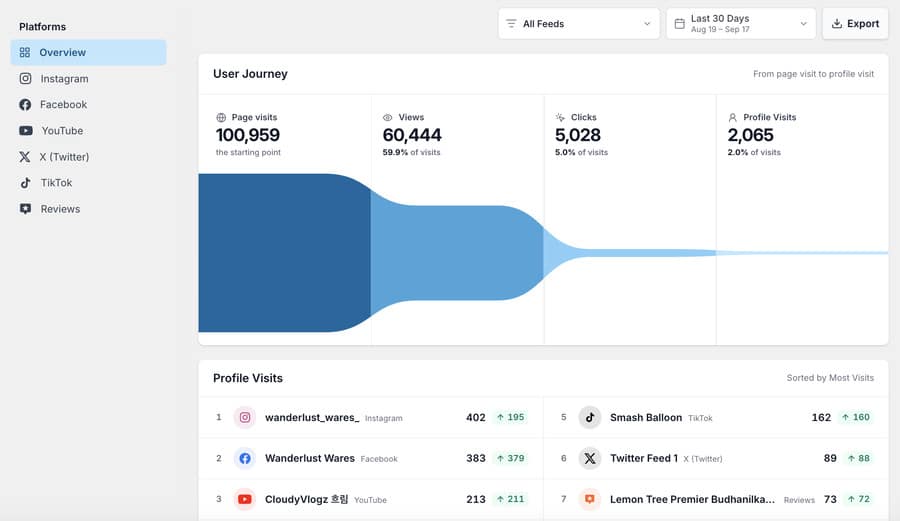
Clicks and views tell you the two ends of a visit. The User Journey card fills in the middle, laying out four stages in order, each one shown as a share of the first.
- Page visits: how many people landed on a page with one of your feeds on it
- Views: how many scrolled far enough for the feed to reach their screen
- Clicks: how many tapped a post inside it
- Profile Visits: how many carried on to your Instagram, Facebook, or YouTube account
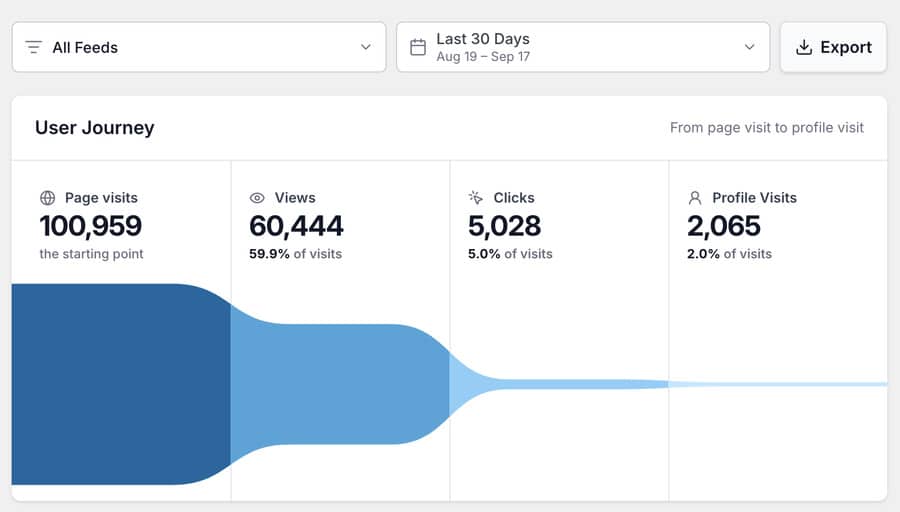
Page visits is the number that makes the other three mean something.
Four hundred clicks is a strong week or a weak one entirely depending on how many people saw the page, and that count now sits directly above it.
Here is the shape of a typical week: 1,000 people land on the page, 600 scroll far enough to see the feed, 45 tap a post, and 8 carry on to your Instagram. The drop between any two of those stages is what tells you what to do next.
If the gap sits between Views and Clicks, the posts are the question. A yoga studio getting plenty of eyes on its Reels feed and almost no taps does not need to move the feed, it needs different clips.
If the gap sits between Page visits and Views, placement is the question. A coffee roaster whose feed sits below three blocks of copy on its wholesale page gets more out of moving it up than out of swapping the photos.
See Which Profile Your Site Sends People To
If you run several accounts, the Profile Visits panel ranks them by how many visits each one picked up from your site, with a marker showing whether that rose or fell since the period before.
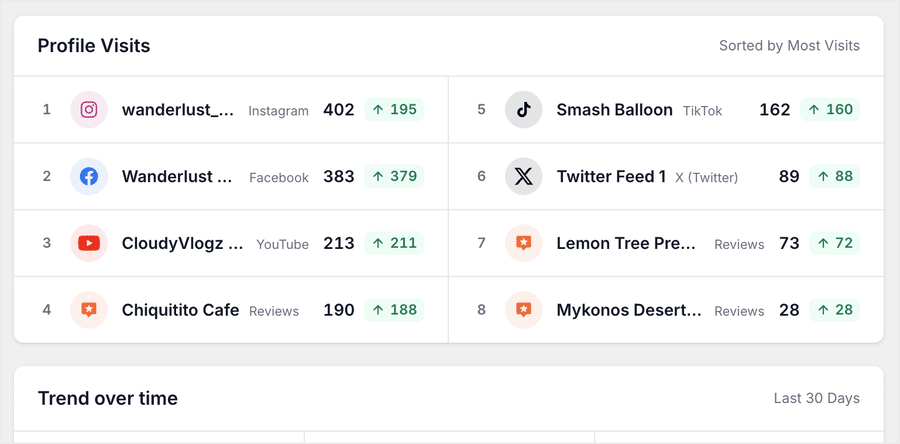
Facebook might be collecting more profile visits than Instagram, even though Instagram takes most of your posting effort. That is a fair reason to rebalance where the effort goes.
The reverse turns up a lot with YouTube: plenty of views on the feed, almost nobody clicking through to the channel. If subscribers are the point of running it, that gap is the thing to work on.
And if one connected account is pulling nothing at all, move it somewhere better on the page and check back next week to see whether that changed anything.
Compare Views, Clicks, and Profile Visits Side by Side
A single total tells you where you stand today, but not whether you are gaining ground.
So Views, Clicks, and Profile Visits each get their own total, a small line chart, and a marker showing whether they rose or fell against the period before, with all three lined up next to each other.
Point at a Tuesday in one chart, and the other two jump to that same Tuesday, so you are never comparing last Thursday’s views against this Monday’s clicks.
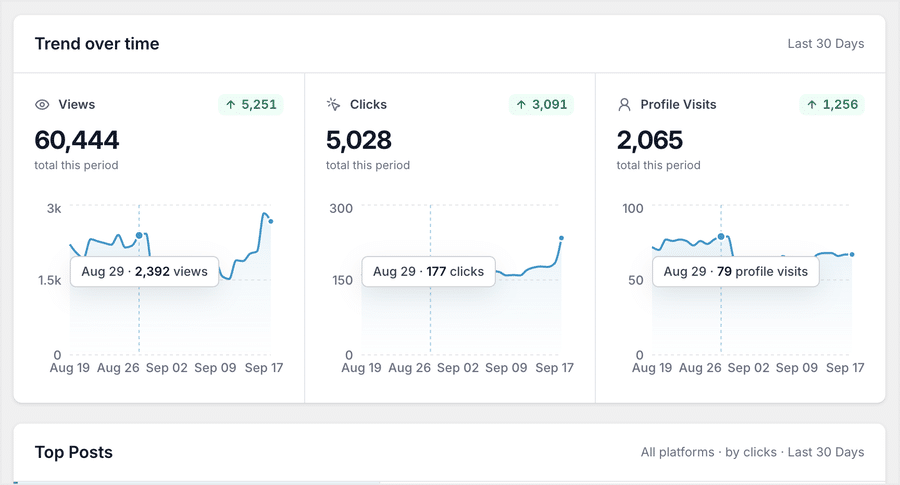
Say you run a florist, and you post arrangements a few times a week without much of a system behind it.
Switch to the Views chart, and the spikes line up with your seasonal arrangements every single time, while the studio shots barely register. That is next month’s content calendar written for you, and it took about thirty seconds to find.
The more useful signal is when two of the lines disagree.
If views keep climbing while profile visits stay flat, people are looking at your feed and stopping there. Nothing in it is giving them a reason to tap through to your account, which tends to be about what the posts say rather than how they look.
So, adding a line like “full gallery on Instagram” to the captions you feature is the kind of change that shows up in the Profile Visits line within a week or two.
The same goes for a promotion you are deciding whether to repeat. Views and clicks both up across those seven days, then settling back afterwards, is a promotion that did its job while it ran.
Views up with clicks flat means more people saw the feed but engaged with it no more than usual, which is worth knowing before you book the same thing again.
Reach Any Platform in One Click
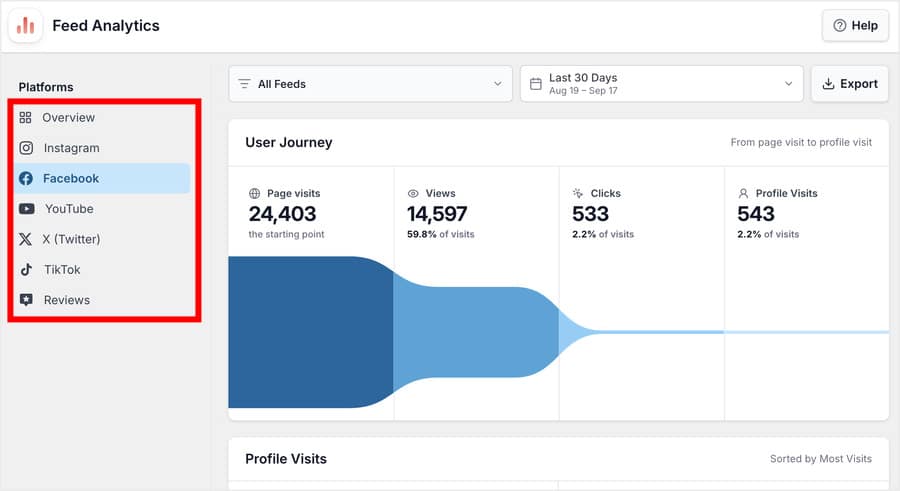
A dashboard you have to dig through is a dashboard you stop opening. So every platform sits in a rail down the left side, Overview at the top with Instagram, Facebook, YouTube, X (Twitter), TikTok, and Reviews underneath, one click each.
On a narrow screen the rail folds into a strip across the top, so checking a number on your phone between appointments still works.
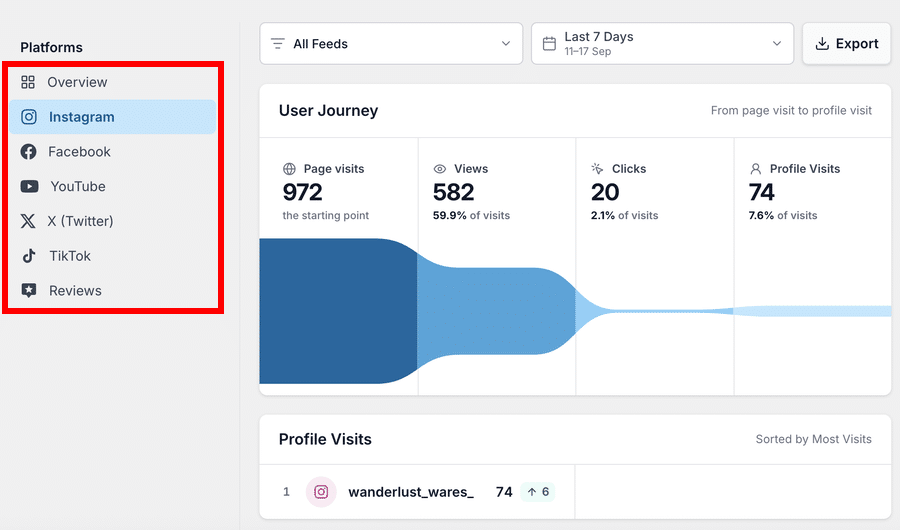
Platforms you have not installed appear too, marked “Not installed,” which is a quiet way of noticing you have a TikTok account and no TikTok feed anywhere on the site.
Each platform also has its own web address. Bookmark the one you check most and it opens directly, so your Monday morning check costs a click instead of a detour through Overview.
Your browser’s Back button follows the same trail, so going from Instagram to Reviews and back again is one press.
And when a client emails asking how the feed did last month, you send a link that lands on the platform you are looking at, rather than talking them through which tab to open.
See Your Best Posts for the Window You Picked
Top Posts ranks the posts inside your feeds by clicks, with each row showing the preview image, the post text and how long ago it went up. Select any row and you get its views and clicks side by side, each with its own chart for the window you picked.
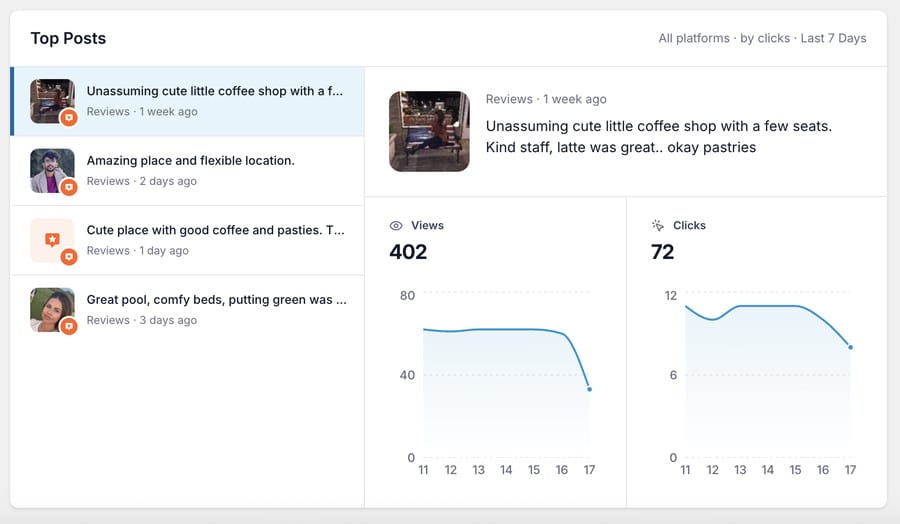
Every number covers the date range you selected, so a 30-day view shows what worked in those 30 days and nothing older.
That gives you something to act on the same day. Pin the top post to your booking page, put it in this week’s email, or use it as your next ad. And if you have just finished running a sale, the list tells you which post brought in the clicks, so you know what to repeat next time.
You can also compare one platform against another. If your Instagram posts are earning clicks and your Facebook posts are not, you can cut back on Facebook or change what you post there, rather than posting the same thing everywhere and hoping.
Export Your Numbers as a File
The Export option saves two files: your daily numbers and your top posts. Pick the platform and date range first, and only that slice gets exported.
Both come out as JSON, which is the format a reporting tool or a developer will want, so these are files you feed into something else rather than open and read.
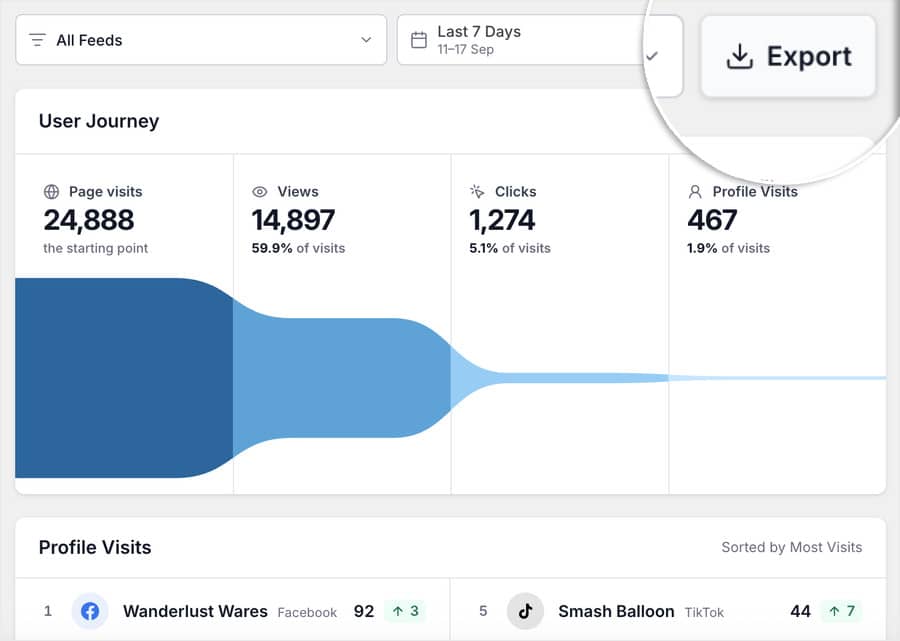
That is useful in three places. You can drop one client’s Instagram figures straight into your own monthly report template. You can bring exact numbers to a budget conversation instead of a screenshot of a dashboard.
And you can keep a quarterly copy of your own data outside WordPress, so you still have it if you change hosts or rebuild the site.
Try Every Report Before You Have Any Data
A new install has no events in it, so every chart would start out empty. Sample data mode fills all of the reports with realistic demo figures instead, so you can see exactly what each one will show you once your own data arrives.
It is rendered on screen only and writes nothing to your database, and one click switches to your real numbers.
Feed Analytics Pro can also download, install and activate itself from the page, so there is no plugin file to fetch from your account and no upload screen to work through.
How to Set Up Feed Analytics Pro 2.0.0
Feed Analytics Pro comes with the All Access Bundle and with any Elite license on any single Smash Balloon plugin, so if you are on either, you already have it. Installing takes about five minutes, and your first real numbers arrive a few hours later.
Step 1: Install or update
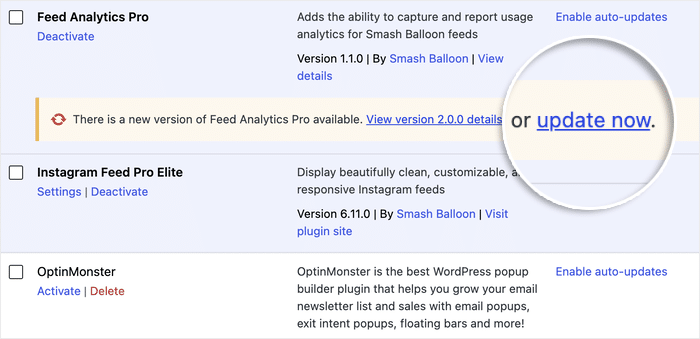
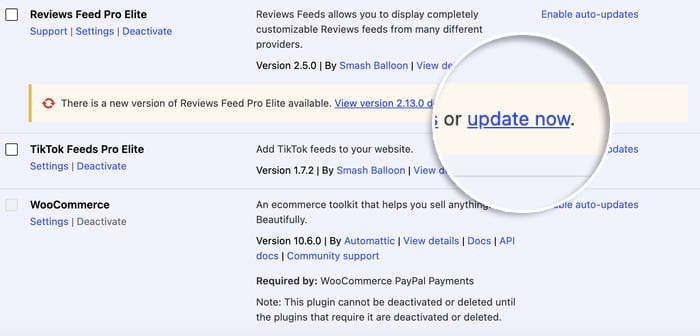
Already running Feed Analytics Pro? Update to 2.0.0 from Plugins in your WordPress dashboard, and this step is done.
If you have never installed it, log into your Smash Balloon account and open your Downloads page. Your Elite license card lists Feed Analytics as an included download alongside your main plugin.
Install it the same way you installed that plugin, then activate it with the same license key. On a site where your main plugin is already active, the two share one activation, so it doesn’t use up another site on your license.
Step 2: Update Reviews Feed, if you want the Reviews report
The Reviews report needs Smash Balloon Reviews Feed Pro 2.13.0 or newer, so update that from Plugins at the same time. On an older version you get an amber notice with a link to the update, plus the Feeds table.
Step 3: Open the dashboard
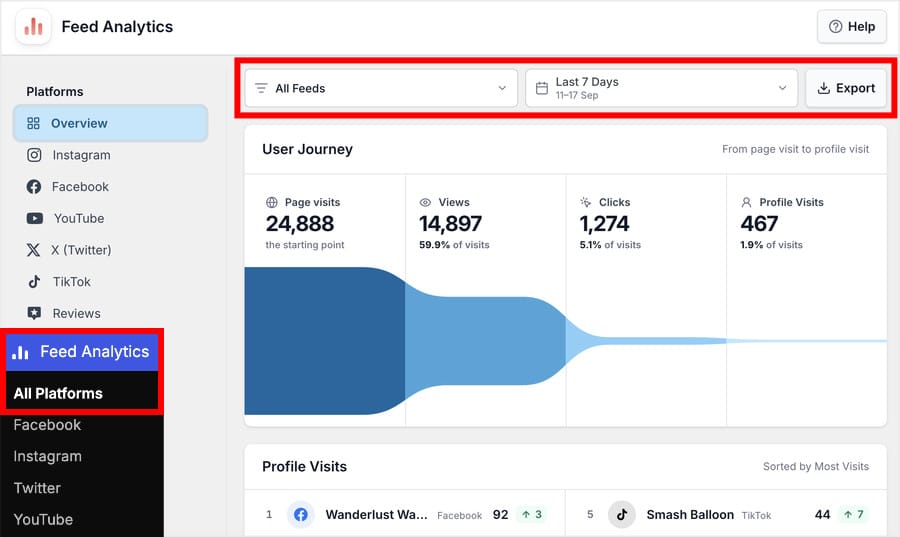
Go to Feed Analytics in your WordPress admin menu. The rail on the left lists Overview first, then each platform, with anything you have not installed marked “Not installed.” Set the date range at the top, and every number below it covers that window.
Step 4: Start with the Overview
Read the User Journey card first, top to bottom: page visits, views, clicks, profile visits. The largest percentage drop between two stages is the thing to fix first.
Below it, the Profile Visits panel shows which account your site sends people to, and the three trend charts show whether each number is rising or falling. Click any platform in the rail to see the same reports for that platform on its own.
Step 5: Open the Reviews report
Select Reviews in the rail. The Reputation card gives you your rating and star breakdown, the Freshness card tells you how current your reviews look, and the Sources and Feeds tables show where your reviews come from and which pages they appear on.
Expand a feed row to list its pages. Scroll to Recent reviews and select one to see its read rate against the rest of that feed.
After that it updates on its own. Your own admin activity is excluded, so nothing you do while testing a feed shows up in the numbers.
A Few Questions You Might Have
Is Feed Analytics a separate plugin?
Yes, it is its own companion plugin rather than a setting inside your feed plugins, so you install and activate it separately using the license key you already have. Here is who gets it:
- Free: not included
- Basic: not included
- Plus: not included
- Elite: included, on any single Smash Balloon plugin
- All Access Bundle: included, as always
How soon will I see my own numbers?
Give it a few hours after activating. Tracking starts right away, but the reports need visitor events to come in before there is anything to show. Sample data mode covers that gap if you want to look around immediately.
Do I need Reviews Feed to use this?
No. Everything except the Reviews report works on your Instagram, Facebook, YouTube, X (Twitter) and TikTok feeds on its own. For the Reviews report you need Smash Balloon Reviews Feed on 2.13.0 or newer, which is free on both the free and Pro versions.
Do I need to buy a new license key?
No. Use the key already tied to your Elite plan or your All Access Bundle.
Do I need to set up tracking on each feed?
No. Tracking runs as soon as the plugin is active, across every feed you have already built. There is no code to add and nothing to configure feed by feed.
Will my own visits inflate the numbers?
No. Logged-in admin activity is excluded, so your team browsing the site while you build a feed never counts.
What do I get when I export?
Two JSON files, your daily numbers and your top posts, filtered to the platform and date range you pick. They are for feeding into a reporting tool rather than reading on their own.
Start Tracking What Your Feeds Actually Do Today
We have been through the Reviews report, read rate on individual reviews, the four stages visitors move through before they reach your profile, the trend charts, the platform rail, Top Posts and the export.
I’ve seen how this approach can really make a difference. Once you know which review gets read and which post earns the clicks, your content decisions stop being guesses and start being choices.
Your feeds are already collecting all of that activity. What has been missing is somewhere to read it without stitching together a separate analytics tool.
That’s precisely where Smash Balloon Feed Analytics Pro shines. It puts every number from every feed you run into one dashboard inside WordPress, from your star rating and per-review read rates to page visits, clicks and profile visits on each platform.
Here’s what I suggest:
- Update Feed Analytics Pro to 2.0.0 from Plugins, and Reviews Feed to 2.13.0 alongside it
- Open the Reviews report and find the review with the highest read rate on your pricing page
- Read the User Journey card for your busiest page and note the biggest drop between two stages
- Not on a plan that includes it yet? Get the All Access Bundle, or upgrade to Elite on the plugin you already run, and Feed Analytics Pro comes with it
See what your feeds are actually doing
Follow visitors from landing on the page to opening your profile, and see which posts and reviews earn the clicks. Included with any Elite license or the All Access Bundle, with a 14-day money back guarantee.
Get Feed Analytics ProHave any questions about Feed Analytics Pro? Just let me know in the comments below!
So which are you opening first, your review read rates or the four stages on your busiest page? Let us know in the comments.