Social Wall
  Feed Analytics

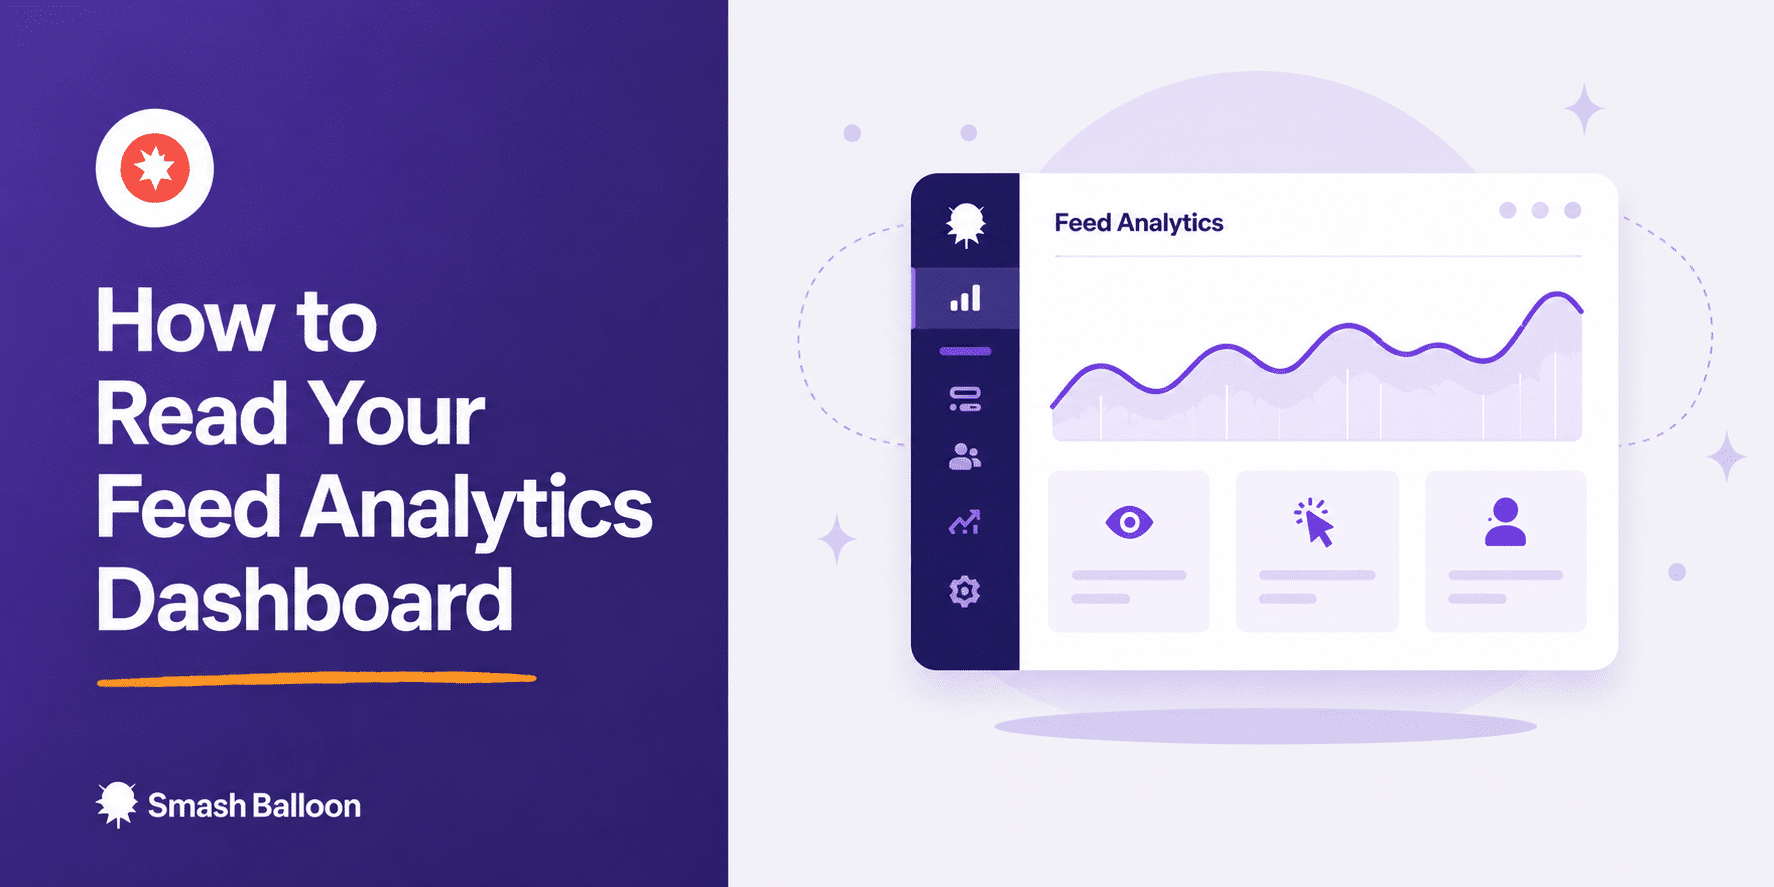
If you’re running Smash Balloon Feed Analytics, you already have real data sitting in your WordPress dashboard right now. Most people never open that tab.
That’s not unique to Feed Analytics either. Almost 20% of marketers say building a truly data-driven marketing strategy is one of their biggest challenges this year, according to HubSpot’s 2026 State of Marketing report. The tools exist, most people just haven’t built the habit of checking them.
I check mine every week, and it’s the fastest way I’ve found to answer a question every site owner eventually asks. Is this social feed actually doing anything, or is it just decoration?
What Does the Feed Analytics Dashboard Show Me?
Smash Balloon Feed Analytics shows three core stats for every feed on your site: views, clicks, and profile visits, plus a breakdown of your top performing posts.
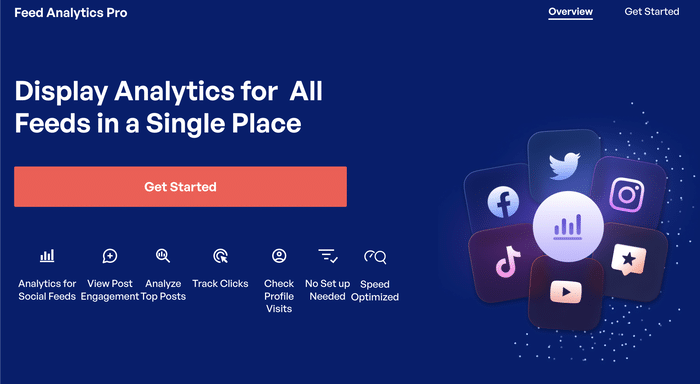
Here’s exactly how to read each one, what to do with what you find, and where in the dashboard to look for it.
Smash Balloon helps website owners turn real social content into trust signals that increase credibility and conversions, and this dashboard is where you prove it’s working.
Feed Analytics vs. Checking GA4 Manually
Before Feed Analytics, the only way to guess at feed performance was digging through Google Analytics and hoping the referral data lined up. Here’s how the two actually compare.
| What you need to know | Manually Checking GA4 | Smash Balloon Feed Analytics ⭐ Recommended |
|---|---|---|
| Can you see clicks on individual feed posts? | ⚠️ Partial, only if you’ve set up custom event tracking for every feed link | ✅ Yes, tracked automatically the moment it’s installed |
| Do you need a separate reporting tool to check it? | ❌ Yes, requires navigating GA4 reports and filtering by referral source | ✅ No, lives right in your WordPress dashboard |
| Can you see which social profile a visitor clicked through to? | ❌ No, GA4 shows outbound clicks generically, not which specific profile | ✅ Yes, Profile Visits are tracked as their own metric |
| Do you need any setup or tagging first? | ❌ Yes, requires manually tagging outbound links to track clicks at all | ✅ No, starts tracking automatically |
| Best for | Sites that already have someone pulling custom GA4 reports regularly | Anyone who wants feed performance data without extra setup or a separate tool |
If you’re already comfortable digging through GA4 and have time to set up custom tracking, it can work. But if you just want a fast answer to which feed is actually performing, Feed Analytics gives you that instantly without leaving WordPress.
Where to Find Your Feed Analytics Dashboard
Accessing the Dashboard
Feed Analytics comes with every All Access Bundle plan, so if you’re already on AAB, it’s already installed and collecting data.
In your WordPress dashboard, go to Feed Analytics in the left sidebar menu. You’ll land on the Overview tab first.
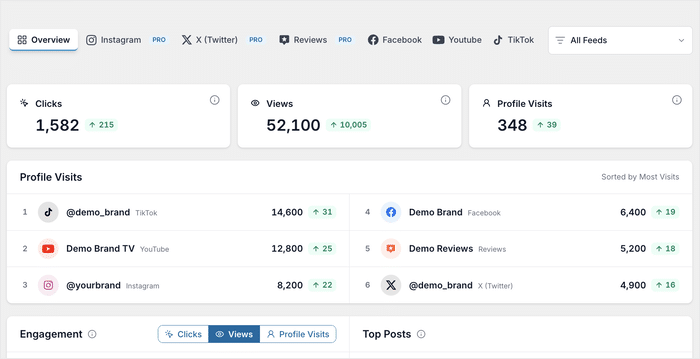
Here’s what you’ll see. A row of three KPI cards sits at the top for Clicks, Views, and Profile Visits, each with a small trend arrow showing whether it’s up or down since your last period.
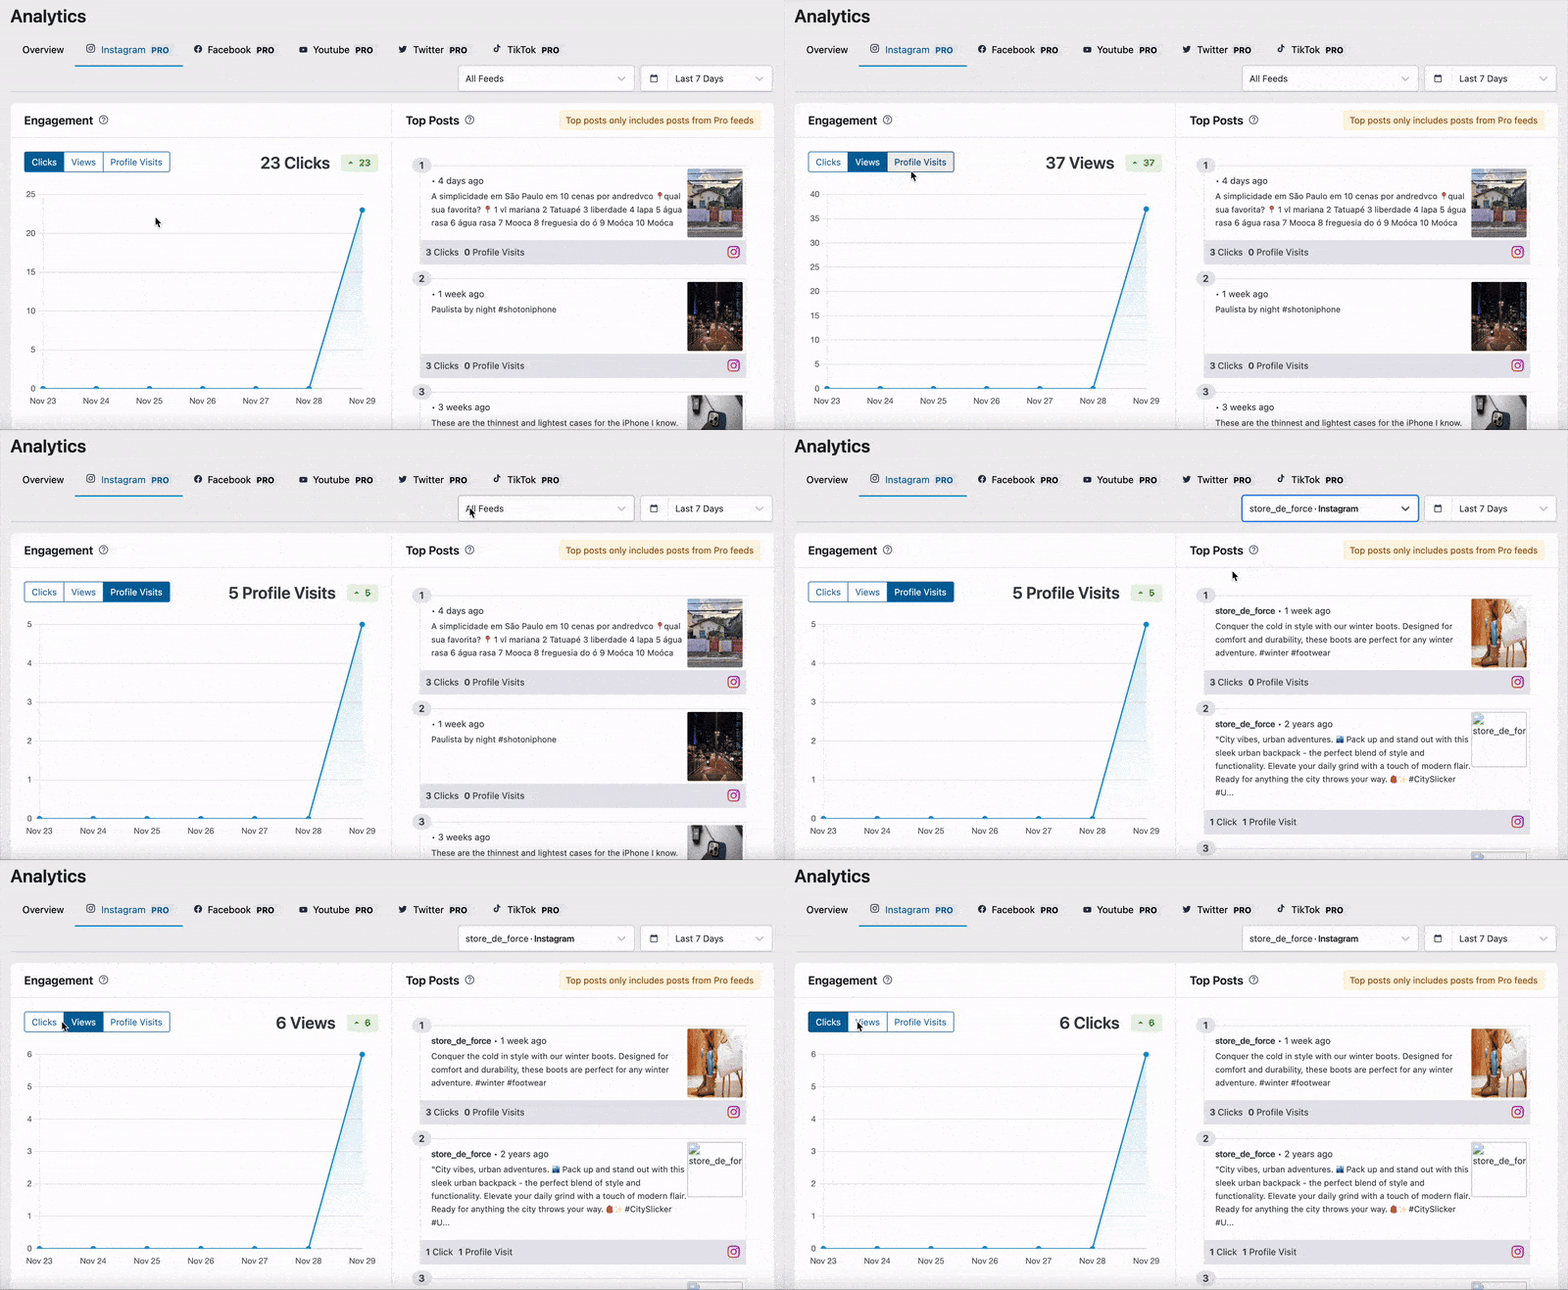
Below that is one engagement chart that plots all three metrics over time, with a toggle so you can view them one at a time or layered together. Underneath the chart is a scrollable Top Posts list, ranking your best performing posts by clicks and visits.
Across the top of the dashboard, you’ll find a tab for each platform: Instagram, Facebook, YouTube, X, TikTok, and Reviews. X was formerly known as Twitter, but the tab itself is just labeled X.
I’d start on Overview to get the big picture, then click into whichever platform looks weakest to figure out why.
Understanding Each Stat
Views
Views count every time your feed content is seen on your site, including repeat views from the same visitor.
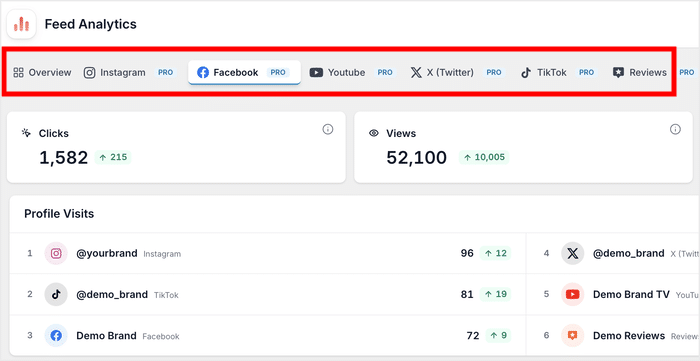
This is your reach number. A rising view count means more people are landing on the pages where your feed lives, not necessarily that they’re doing anything with it yet.
If views are high across the board but clicks and profile visits stay flat, the feed is visible but not doing any real work. That’s usually a design or placement problem, not a content problem, so it’s worth testing a different layout or moving the feed higher on the page before you touch the content itself.
Clicks
Clicks track how many times visitors actually click on a post inside your feed. If views are climbing but clicks stay flat, the feed is being seen but isn’t interesting enough to stop someone’s scroll.
If clicks are healthy but profile visits are low, people like what they see in the feed but aren’t curious enough to follow through to your actual profile. That gap is worth testing a stronger call to action or a layout that makes the profile link more obvious.
Profile Visits
Profile visits count how many times a visitor clicked through to your actual social profile, on Instagram, Facebook, or wherever the feed pulls from. This is the strongest signal in the dashboard. A view is passive. A profile visit means someone cared enough to want more.
A feed with fewer total views but a high profile-visit rate is often more valuable than a high-traffic feed nobody clicks through from, since it’s actually converting attention into followers instead of just sitting on the page.
Top Posts
Below the main stats, each tab has a scrollable Top Posts ranking that breaks down which individual posts or reviews are pulling the most weight. This is where you find out if one specific post is doing most of the work, so you know what kind of content to make more of.
Every tab is built around the same KPI cards, trend arrows, and toggle chart described above, so once you know how to read one platform’s tab, you know how to read all of them.
Filtering Your Dashboard
Filtering by Timeframe
Every tab lets you change the date range: Last 7 Days, 30 Days, 6 Months, 1 Year, or All Time. Each range shows a period-over-period comparison, so you can see if a stat is trending up or down instead of just looking at a flat number.
Filtering by Feed or Account
Within any platform tab, you can filter down to a single connected account or feed instead of viewing the platform’s blended total. If you’re running three separate Instagram feeds across different pages, this is how you check on just one of them.
New to Feed Analytics? Start With Sample Data
If you just installed Feed Analytics, every tab loads with realistic sample data instead of empty charts, so you can see exactly what each report looks like before your feeds have collected any real events. Switching to your real data takes one click once it starts coming in.
See exactly which feeds are earning their spot on your site
Feed Analytics comes with every All Access Bundle plan. Track views, clicks, and profile visits without leaving WordPress.
Get the All Access BundleReading the Dashboard by Platform
Comparing Platforms When You Run Multiple Feeds
If you have feeds running on more than one platform, each one gets its own tab, so you can pull the same stats for just that platform instead of the blended Overview total.
Picture this. You’re running Instagram, Facebook, and a Reviews feed on your homepage. The Overview tab looks fine. But once you check each platform tab separately, you notice Facebook has barely any clicks while Instagram and Reviews are carrying almost all the engagement.
Now you know exactly which platform is dead weight and which two are worth expanding.
Use Cases
Deciding Which Feed Earns Homepage Placement
Say you run a yoga studio site with both an Instagram feed and a Reviews feed on the homepage. If Feed Analytics shows the Reviews feed pulling triple the profile visits of Instagram, that’s a clear signal to give the Reviews feed the top spot instead of splitting attention evenly between the two.
Reporting Performance to a Client or Stakeholder
If you manage a site for a local restaurant client, you can pull up last month’s Profile Visits trend for their Instagram tab and show them exactly how many people clicked through toward following the account, instead of just telling them the feed is doing fine.
Tracking Which Reviews Actually Convert
If you’re running Smash Balloon Reviews Feed, Feed Analytics tracks which individual reviews drive the most clicks and profile visits.
This matters because reviews are one of the strongest trust signals you can put on a page. 63% of consumers are more likely to purchase from sites displaying reviews, and 72% won’t act until they’ve read positive reviews first.
Feed Analytics tells you which specific reviews are actually earning that trust instead of just displaying them and hoping.
A boutique hotel might find that reviews mentioning a specific amenity, like an on-site spa, get clicked far more than generic five-star ratings, which tells you what to highlight in your own marketing too. I go into a lot more detail on this in my post on tracking review performance specifically.
Frequently Asked Questions
Does Feed Analytics track what happens after someone visits my social profile?
No, it only tracks the click-through moment from your site to the profile. What a visitor does once they land on Instagram or Facebook isn’t something Feed Analytics can see.
Can I see analytics for just one feed instead of all my feeds combined?
Yes, each platform gets its own tab, and within that tab you can filter down to a single connected account or feed instead of viewing the combined total.
Does my own team browsing the site show up in the stats?
No, logged-in admin activity is automatically excluded from tracking, so your team checking the site never inflates your numbers.
What happens if I haven’t collected any real data yet?
You’ll see realistic sample data in every tab instead of empty charts, so you know what each report looks like before your feeds start collecting real events. Switching to your live data takes one click.
Does a view count if the same visitor sees my feed twice?
Yes, views count every impression including repeat visits from the same person, so views measure total reach rather than unique visitors specifically.
Is Feed Analytics a separate paid add-on or is it included?
It’s included with every All Access Bundle plan at no extra cost. It isn’t sold as a standalone product or included in individual plugin tiers.
Start Reading Your Feed Analytics Dashboard Now
This dashboard covers the stats that actually tell you whether your social feeds are working: views, clicks, and profile visits, plus which specific posts are driving those numbers.
I’ve seen how checking this even once a week can completely change which feed gets homepage placement and which one gets pulled.
Once you know what’s working, the next step is making sure your best performing feeds are set up to keep performing. That’s precisely where Smash Balloon shines.
The All Access Bundle gives you every feed type in one plugin, plus Feed Analytics built in from day one, so you’re never guessing which platform deserves your attention.
Here’s what I suggest:
- Check your Feed Analytics dashboard this week and note which platform has the highest profile visits
- Compare that against which feed currently has the best placement on your site
- If there’s a mismatch, move your best performing feed to a more prominent spot
- Get the All Access Bundle if you don’t have Feed Analytics running yet
See exactly which feeds are earning their spot on your site
Feed Analytics comes with every All Access Bundle plan. Track views, clicks, and profile visits without leaving WordPress.
Get the All Access BundleHave any questions about reading your Feed Analytics dashboard? Just let me know in the comments below!