Social Wall
 Feed Analytics


Would you like to download your Feed Analytics numbers so you can keep them, share them, or work with them outside WordPress?
In this guide, we’ll show you where the Export button is, how to choose what goes into your files, and what each column in the files means.
Before you get started, make sure Feed Analytics is installed and activated on your site. Export needs real numbers from at least 1 feed. If you only see sample data, see Why Am I Seeing Sample Data in Feed Analytics? first.
- Finding the Export Button
- Choosing What to Export
- Downloading Your Files
- Reading the Daily Metrics File
- Reading the Top Posts File
Finding the Export Button
To get started, we’ll find the Export button.
The Export button is on the Feed Analytics report, under All Platforms and on the page of each platform. It sits at the right end of the row with the feed filter and the timeframe picker.
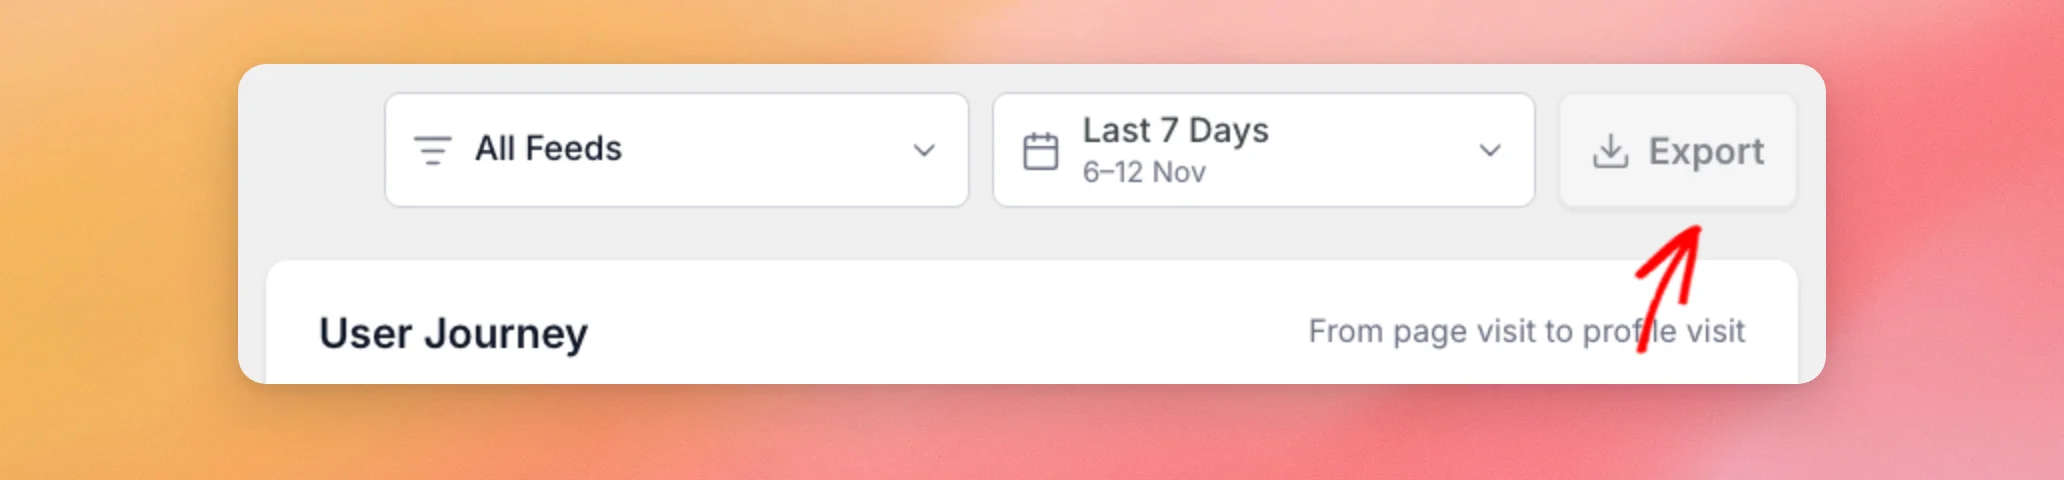
The button only shows up when there is something to report. If you have no feeds yet, or the platform you picked has no feeds, Feed Analytics shows a getting-started screen instead of the report, and the button is hidden.
Export works with your real numbers. While the Sample data banner shows, the Export button is grayed out. Its tooltip reads, “Sample data can’t be exported.”
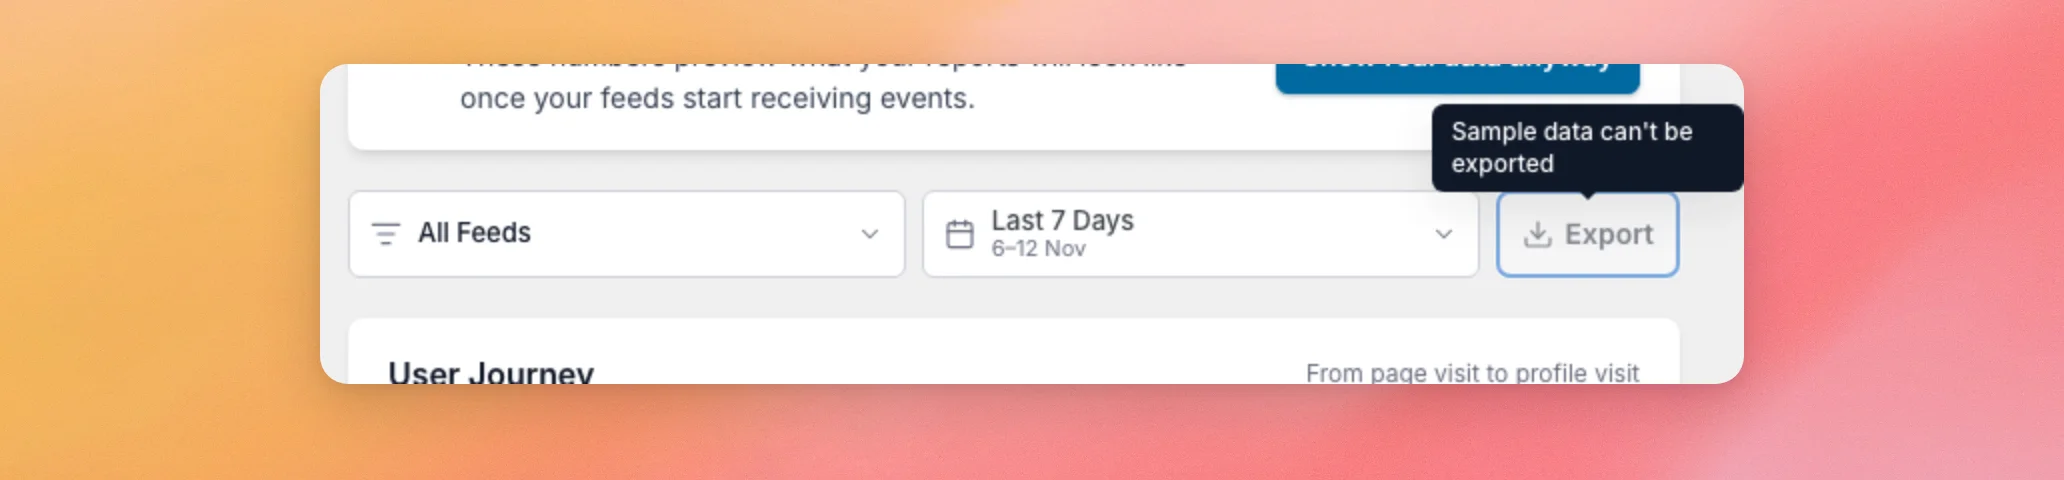
To turn the button on, switch to your real numbers as shown in Why Am I Seeing Sample Data in Feed Analytics?. To learn what the numbers on the dashboard count, see Reading Your Feed Analytics Dashboard.
Next, we’ll look at the choices the Export window gives you.
Choosing What to Export
When your report shows real numbers, click Export. A window titled Export opens. It has 2 groups of choices, Filters and Files. It starts with settings that match the report you were looking at.
Choosing the Filters
The Filters group narrows down which numbers go into your files.
- Platform lets you choose All platforms or a single platform, such as Instagram or Reviews. It starts on the platform page you opened the window from.
- Feed only shows when you picked a single feed in the feed filter before opening the window. The row shows that feed’s name. You cannot change it there. The files hold only that feed’s numbers when Platform is set to the feed’s own platform, so open the window from that platform’s page. To export every feed, set the feed filter to All Feeds first.
- Date lets you choose Last 7 Days, Last 30 Days, Last 90 Days, Last 6 Months, Last 1 Year, or All Time.
The Date choice starts on the timeframe you picked on the dashboard, so you don’t need to pick it again. If you were looking at Last 7 Days, the window starts on Last 7 Days.
Last 90 Days is an extra range the Export window adds to the dashboard’s timeframes.
The days are counted back from today. Today counts as the first day. Days follow UTC. A new day starts at midnight UTC, which may not be midnight where you live.
Last 6 Months is the last 180 days. Last 1 Year is the last 365 days. All Time starts from the first day your feeds recorded an event.
Choosing the Files
The Files group has 2 choices. Both start checked.
- Daily Metrics is described as “Visits, views, clicks and more by date.” It has 1 entry for every day in your date range.
- Top Posts is described as “Your top posts, ranked by clicks.” It holds up to 100 posts.
If you’re not sure, leave both checked. If you don’t need a file, uncheck it. If you uncheck both, the download button is turned off.
Now, let’s download the files.
Downloading Your Files
When your choices are set, click the button at the bottom right of the window. It reads Download JSON when 1 file is checked and Download 2 JSONs when both are checked. Your browser then downloads the files.
Cancel closes the window without downloading anything.
The files are in JSON format, a common plain text format for data. Each file name starts with feed-analytics. The file (daily or top-posts), the platform, and the date range follow. For example, a Last 30 Days export of all platforms is saved with these names.
- feed-analytics_daily_all-platforms_last-30-days.json
- feed-analytics_top-posts_all-platforms_last-30-days.json
If a file you checked has no rows, Feed Analytics does not download it. If neither file has rows, the window stays open and shows “No data for the selected filters.” In that case, try a longer date range or a different platform.
When something goes wrong, the window shows 1 of these messages.
- “Select at least one file to export.”
- “That platform can’t be exported. Pick another one.”
- “That date range can’t be exported. Pick another one.”
- “Sample data can’t be exported. Switch to real data and try again.”
- “Export failed. Please try again.”
If the report itself shows no numbers, see Troubleshooting Feed Analytics When No Data Shows. If you keep seeing “Export failed,” contact our support team.
Next, we’ll go through what is inside each file.
Reading the Daily Metrics File
The Daily Metrics file lists 1 entry for every day in your date range, including days with no activity. Those days show 0 in every number column. Each entry has these fields.
| Field | What it holds |
|---|---|
| date | The day, written as year-month-day, in UTC. |
| platform | “all” when you exported All platforms, or the platform you chose in lowercase, such as instagram or reviews. |
| feeds | How many different feeds recorded at least 1 event on that day. |
| page_visits | Times a page with your feed on it was opened. |
| views | Times your feed was seen. |
| clicks | Clicks on posts in your feeds, and on the button that loads more posts. |
| profile_visits | Click-throughs to your social profile. |
| post_views | Times individual posts were viewed. |
The figures are the same events the dashboard counts. For how each one is counted, see Reading Your Feed Analytics Dashboard.
Reading the Top Posts File
The Top Posts file lists up to 100 posts, ranked by clicks, with the most clicked post first. Each entry has these fields.
| Field | What it holds |
|---|---|
| rank | The position of the post, starting at 1. |
| title | The text of the post. |
| account | The name of the profile the post belongs to. |
| platform | The platform the post comes from, in lowercase, such as instagram. |
| posted | The day the post was published, written as year-month-day. For YouTube videos, the day is approximate. |
| views | Times the post was viewed in your date range. |
| clicks | Clicks on the post in your date range. |
| profile_visits | Click-throughs to the profile that came from the post in your date range. |
That’s it! You can now download your Feed Analytics numbers as Daily Metrics and Top Posts files and read every field in them. Next, learn what each report on the dashboard shows in Reading Your Feed Analytics Dashboard.
Why is the Export button grayed out?
Feed Analytics is showing sample data, and Export works only with your real numbers. To switch to them, click Show real data anyway on the Sample data banner, then try again. See Why Am I Seeing Sample Data in Feed Analytics? for the steps.
Why can’t I find the Export button?
The button is hidden when Feed Analytics shows a getting-started screen instead of the report. This happens when there are no feeds on the site or on the platform you picked. To bring it back, open a platform that has a feed, or choose All Platforms.
Which file format does Export use?
JSON. Each file you download is a plain text file in JSON format. Its name ends in .json.
Why does my Top Posts file stop at 100 posts?
The Top Posts file holds at most 100 posts, ranked by clicks. A shorter date range or a single feed can bring a post you are looking for into the list.
Can I export just one feed?
Yes. Open the page of the feed’s platform, such as Instagram, and pick the feed in the feed filter. Then click Export and leave Platform on that platform. The window shows the feed in its Filters group, and the files hold only its numbers. See the Choosing the Filters section above.