Social Wall
 Feed Analytics


Would you like to see how visitors engage with your Smash Balloon feeds and know exactly what each number counts?
This guide walks through the dashboard in the order it appears on screen.
Before you get started, make sure Feed Analytics is installed and activated on your site, with at least 1 Smash Balloon feed on a page.
If you see a Sample data banner above the report, the numbers are a preview, not your own. See Why Am I Seeing Sample Data in Feed Analytics? for how that works.
- Finding Your Feed Analytics Dashboard
- Choosing a Platform
- Filtering by Feed and Timeframe
- Following the User Journey
- Finding Your Top Profiles
- Reading the Trend Over Time
- Checking Your Top Posts
- Viewing the WordPress Dashboard Widget
Finding Your Feed Analytics Dashboard
To get started, we’ll open the Feed Analytics dashboard.
From your WordPress admin sidebar, go to Feed Analytics » All Platforms.
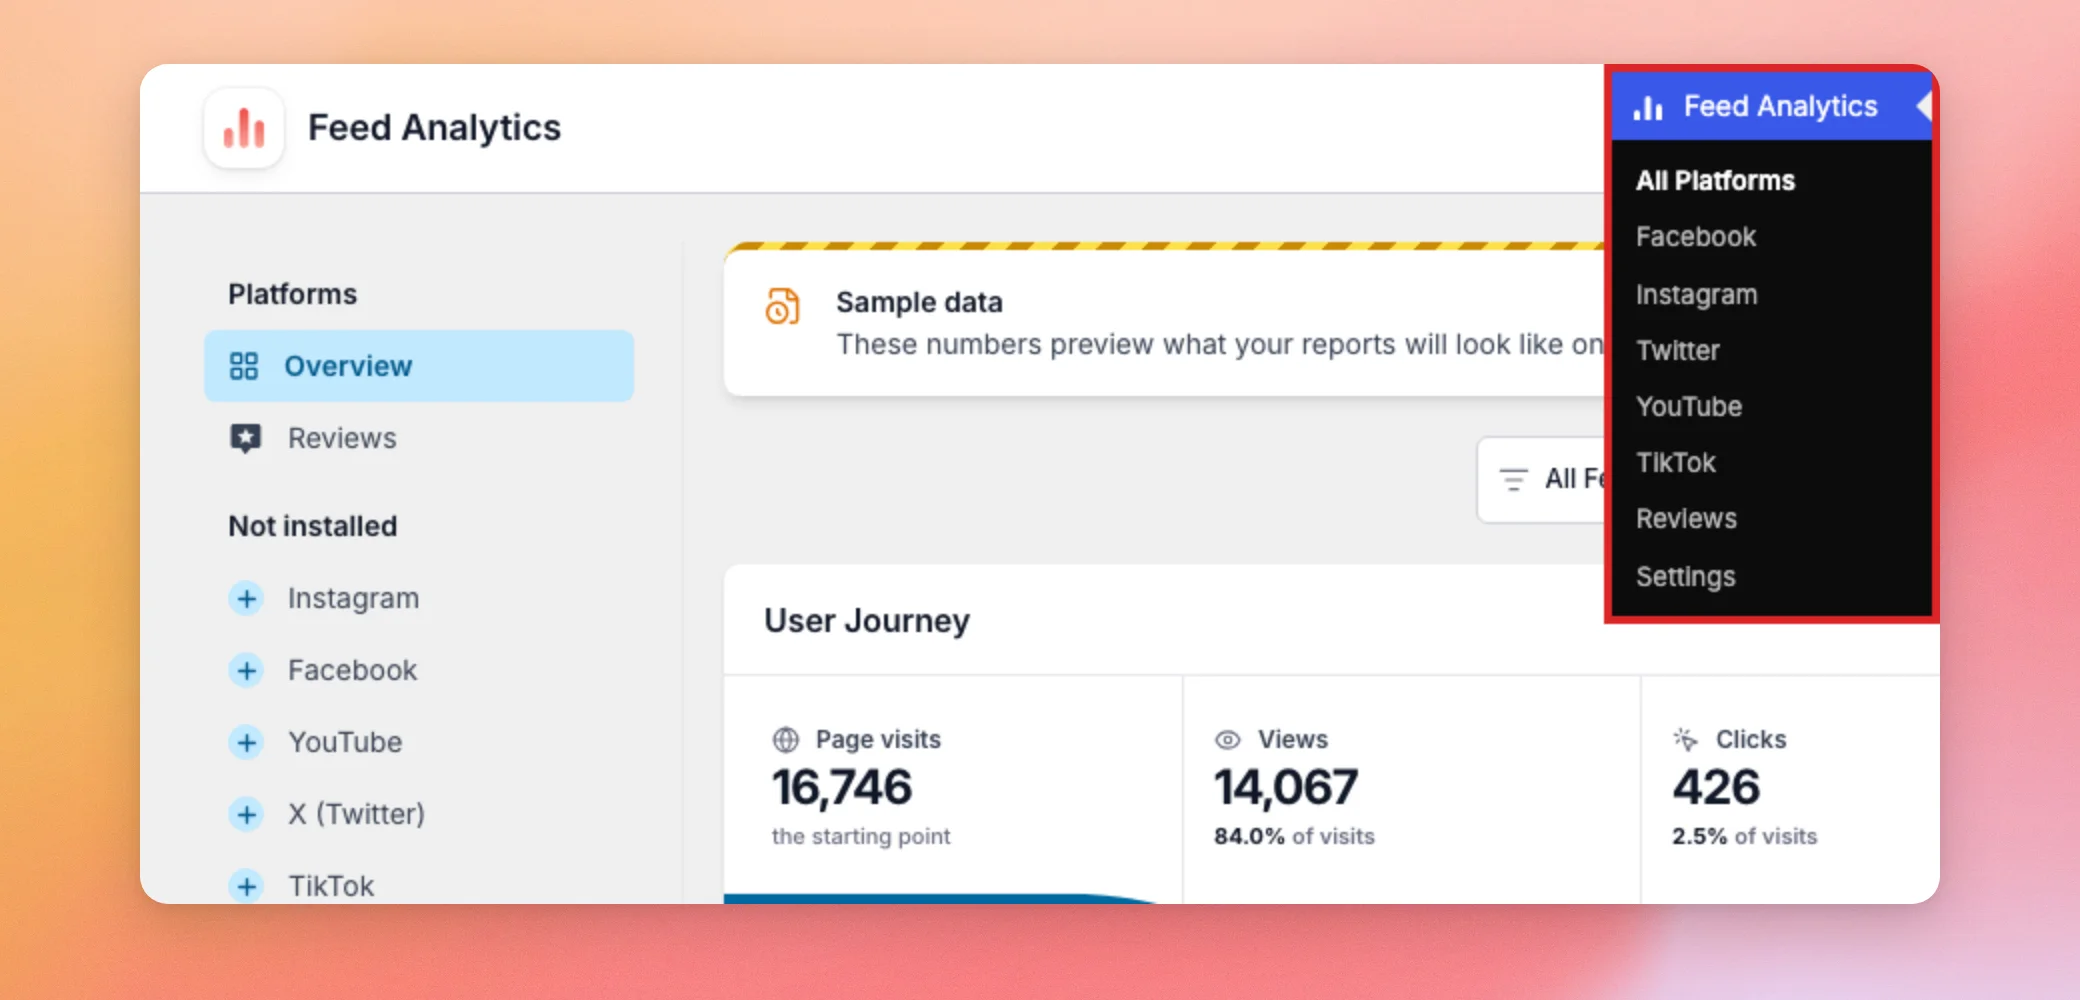
The dashboard opens on Overview. Overview adds up all of your feeds. Until you pick another timeframe, the report covers the last 7 days. That way, the first numbers you see are your most recent ones.
Feed Analytics counts what visitors do with your feeds on your own site, so its figures can differ from the ones Instagram, Facebook, X (Twitter), YouTube, TikTok, and review sites show in their own tools.
Note: Feed Analytics ignores visits from administrators, so checking your own feed while logged in does not add to your numbers. If the dashboard looks empty, see Troubleshooting Feed Analytics When No Data Shows.
Next, you’ll choose which platform to look at.
Choosing a Platform
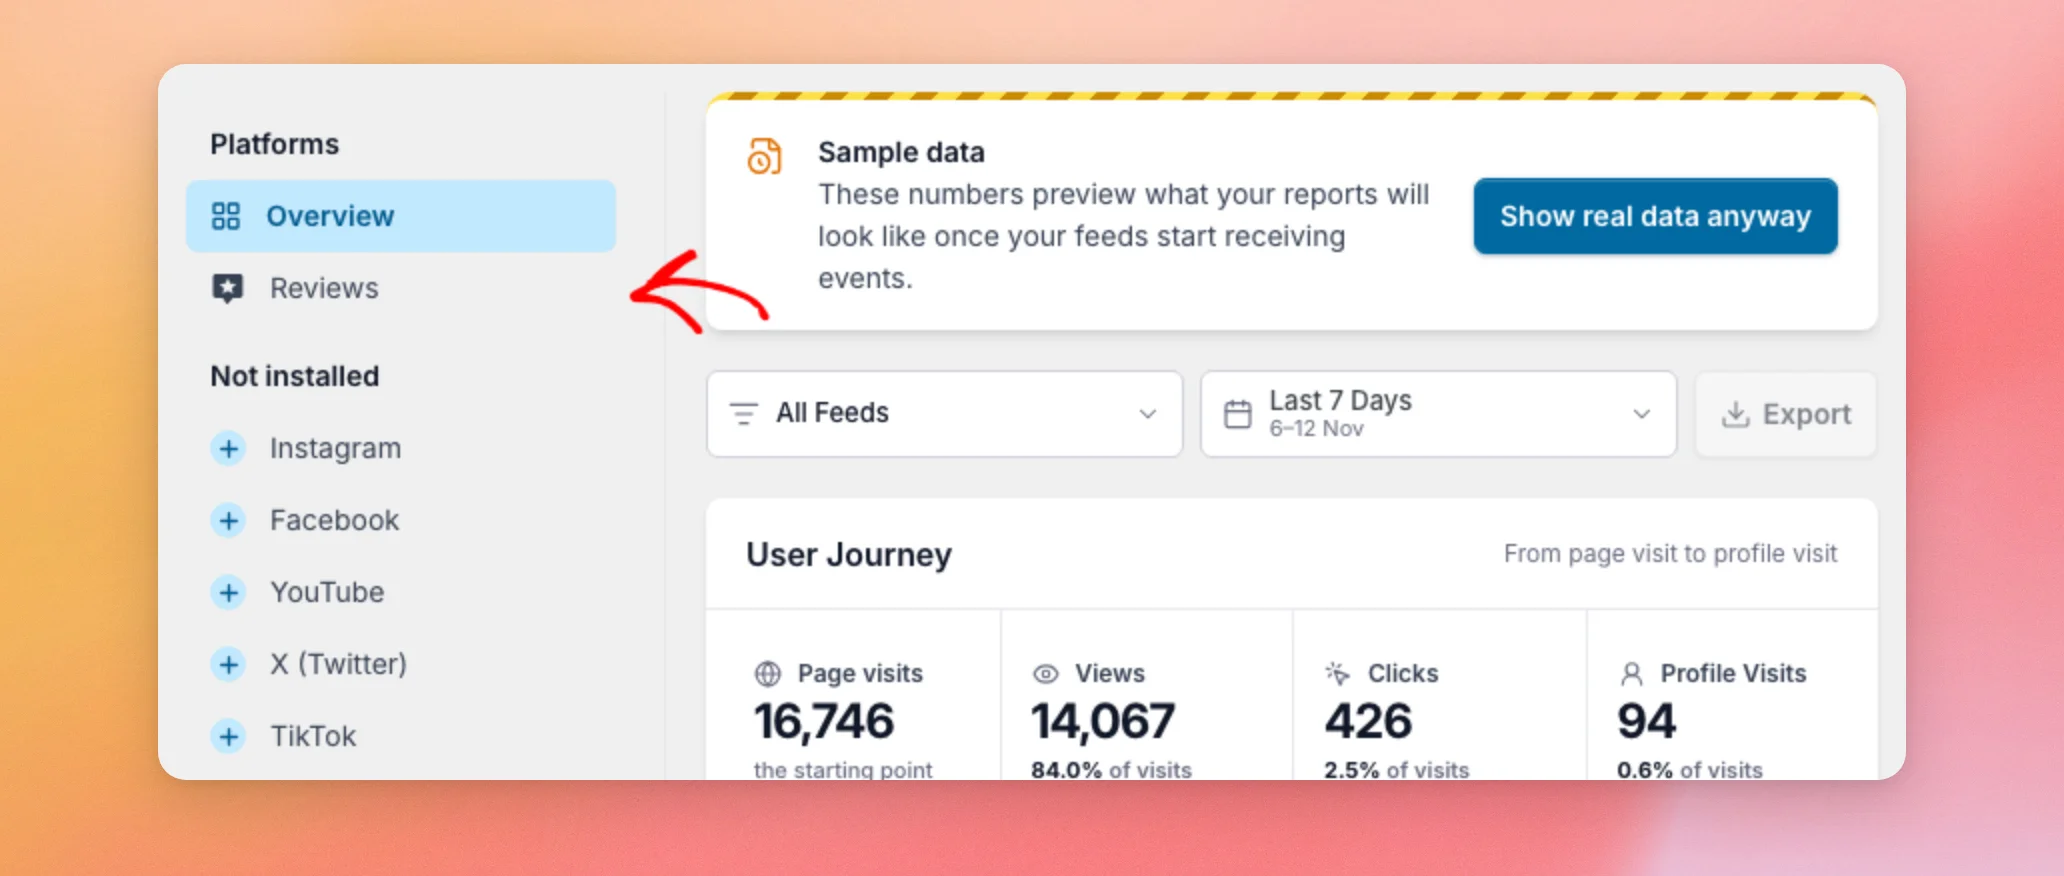
The list on the left is called Platforms. Overview shows every platform together. Below it, you see 1 item for each Smash Balloon feed plugin installed on your site. A site with only Reviews Feed Pro installed shows only Reviews there.
Platforms you have not installed are listed under Not installed. If you choose one of them, Feed Analytics tells you the plugin is not set up yet, instead of showing numbers.
To look at 1 platform, click its name in the list. For example, click Reviews to see the report for your review feeds. For more on that report, see Using the Feed Analytics Reviews Report.
After you pick a platform, you can narrow the report by feed and timeframe.
Filtering by Feed and Timeframe
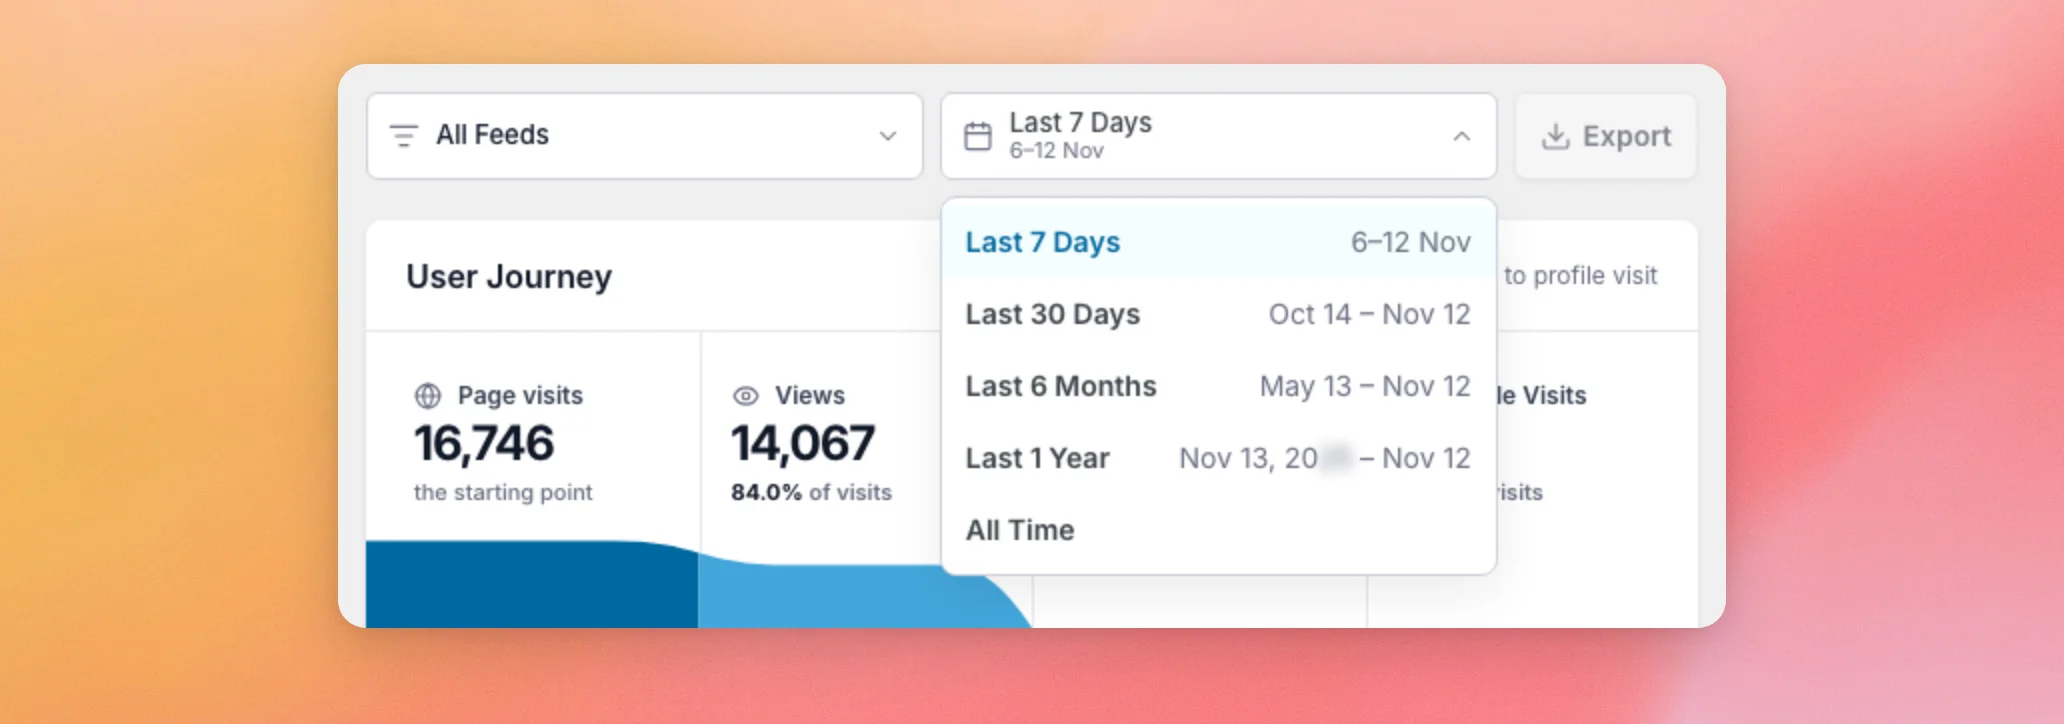
The row above the numbers has two filters. The first is a feed filter set to All Feeds. It lets you focus the report on a single feed. The second is the timeframe picker, set to Last 7 Days. The dates under the name show the exact range it covers.
Beside the two filters sits the Export button. It is turned off while sample data shows. To learn how exporting works, see Exporting Your Feed Analytics Data.
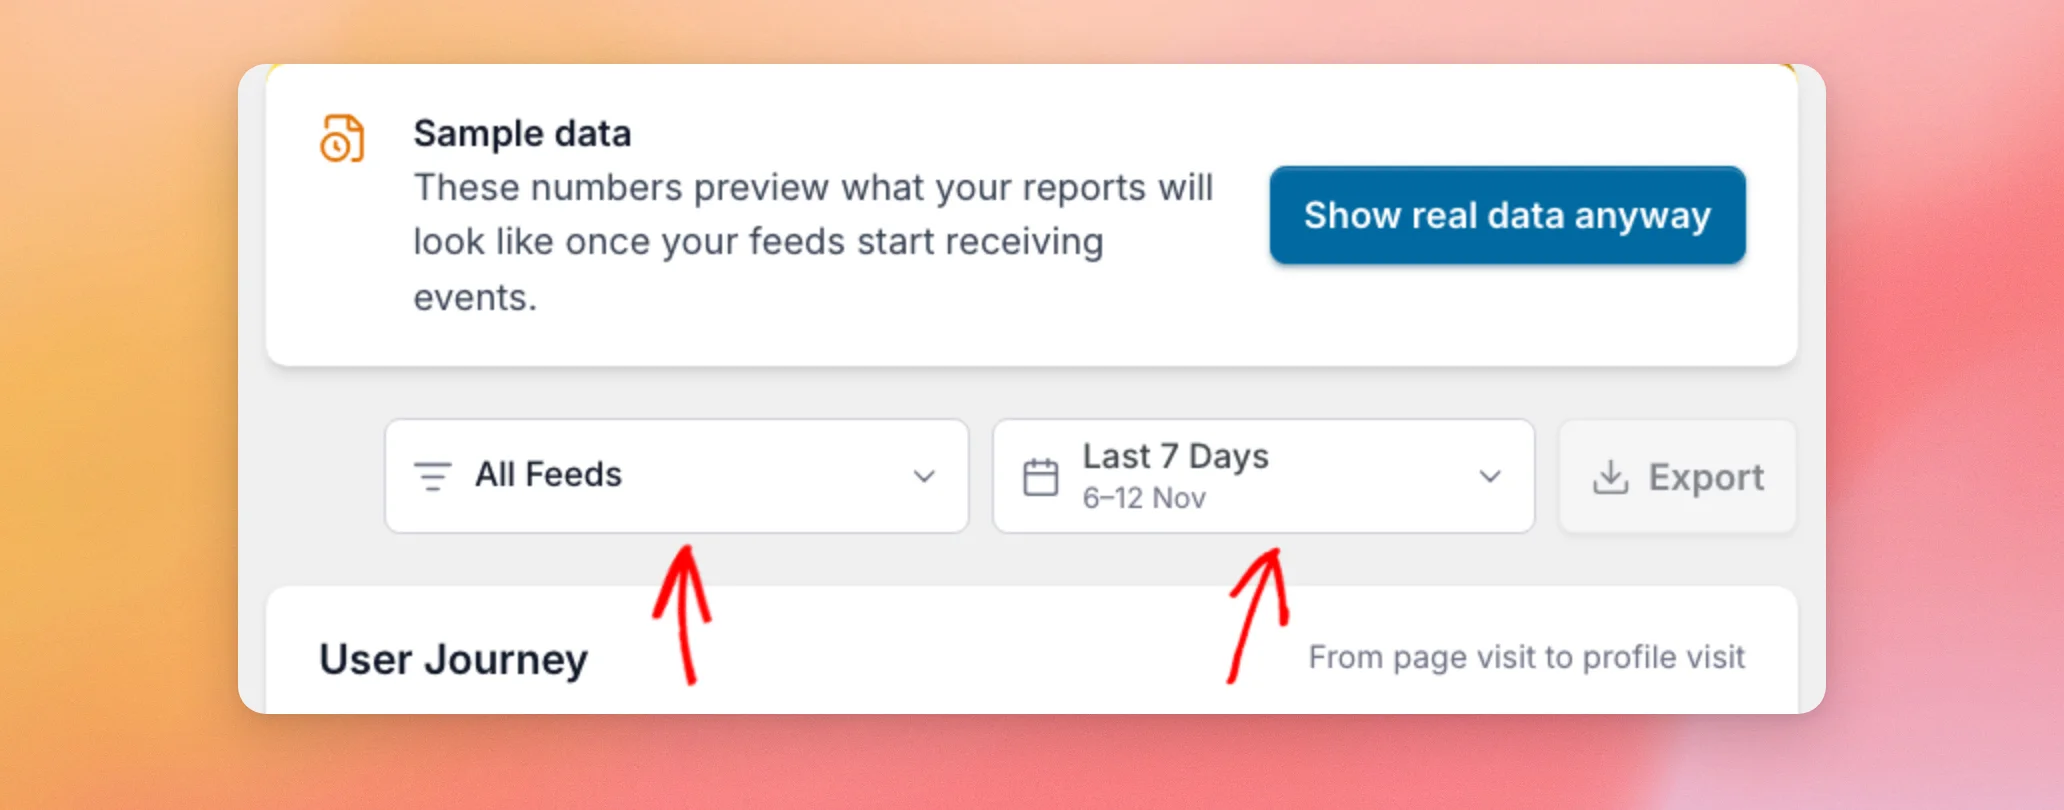
The timeframe picker offers 5 choices: Last 7 Days, Last 30 Days, Last 6 Months, Last 1 Year, and All Time. To see how your numbers trend over extended periods, choose a longer timeframe.
Your feed and timeframe choices are kept in your browser. The dashboard opens the way you left it the next time you visit on the same browser.
With your filters set, the User Journey card shows how visitors move through your feed.
Following the User Journey
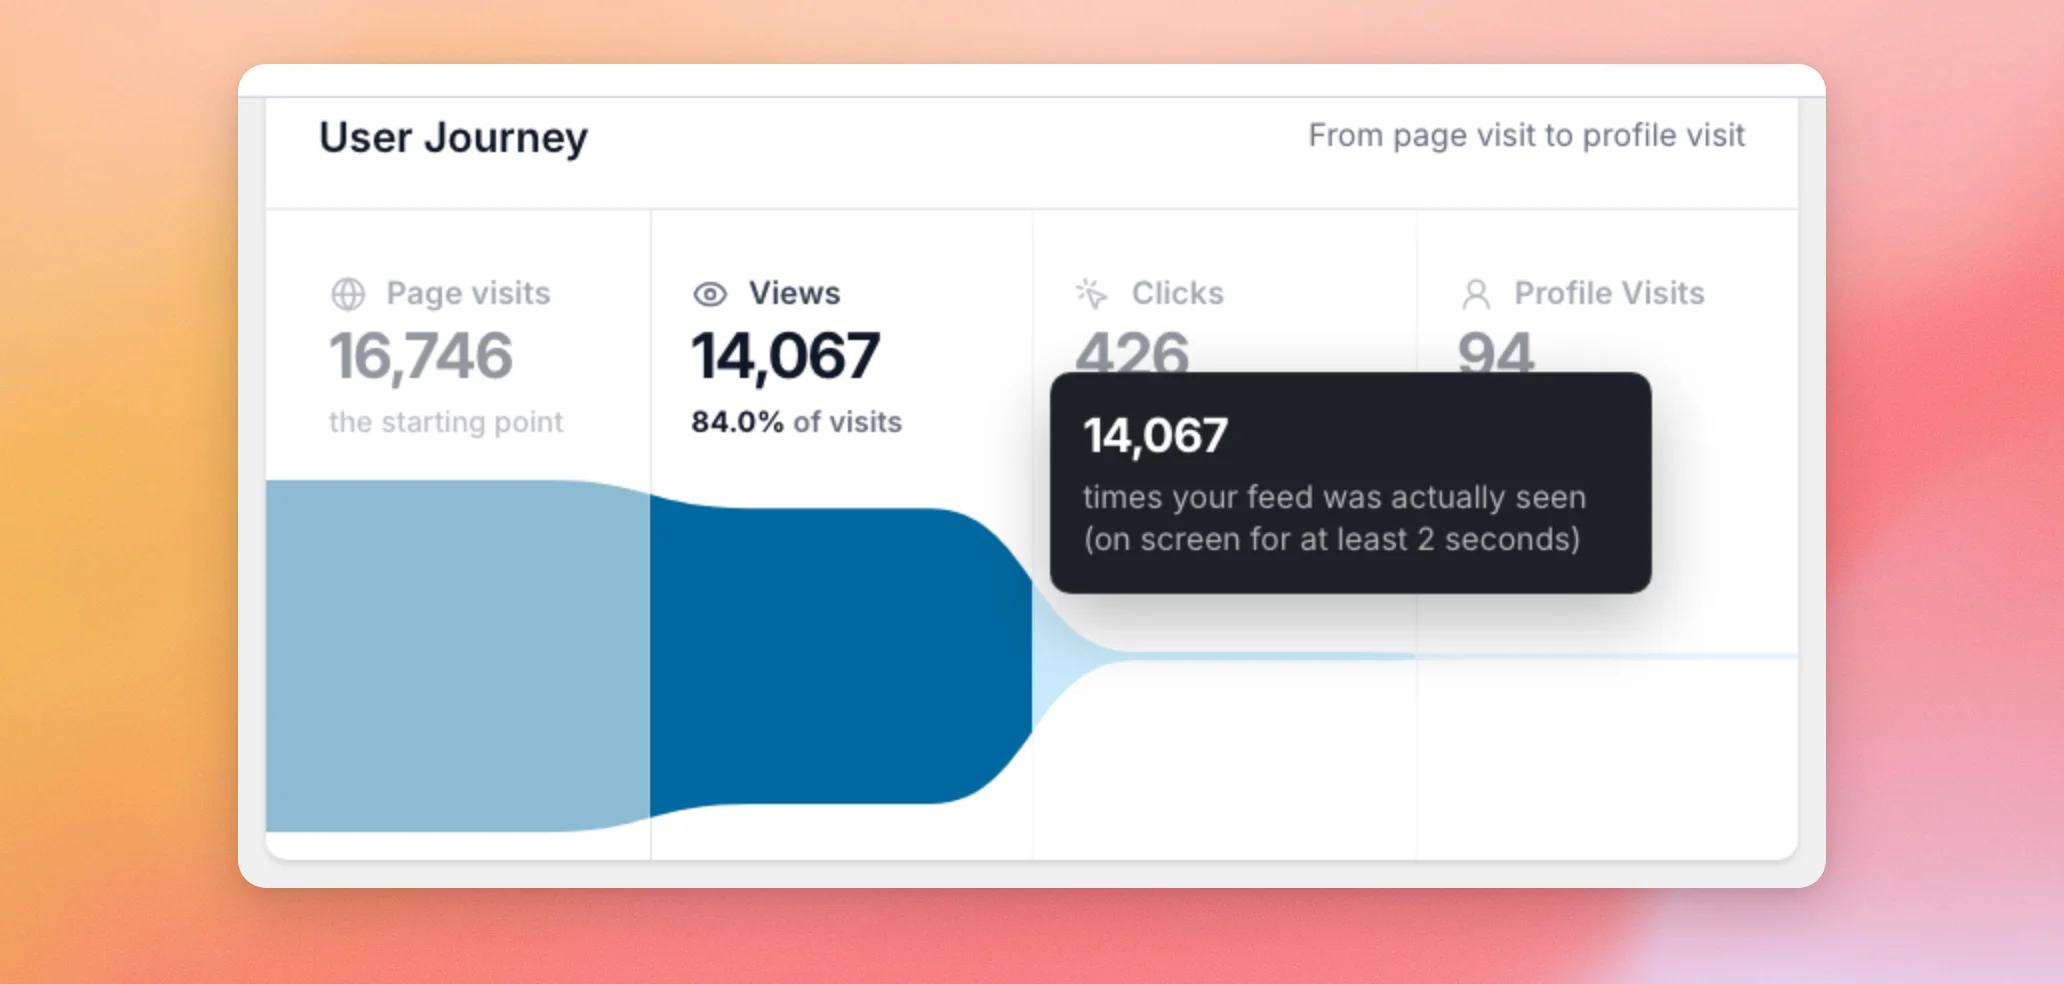
The User Journey card shows how visitors move from opening a page to visiting your social profile. It has 4 stages. Each stage after the first shows its share of page visits.
- Page visits counts how many times a page with your feed on it was opened. It is the starting point for the other percentages.
- Views counts how many times your feed was actually seen. A feed counts as seen when at least 20% of it, or enough of it to fill half the screen, stays on screen for 2 seconds. It is counted once per feed each time the page loads.
- Clicks counts clicks on posts in your feed, and on the button that loads more posts.
- Profile Visits counts click-throughs to your social profile, such as a click on the profile link in your feed header.
Hover over a stage to see a short description of what it counts.
The next card shows which social profiles visitors click through to.
Finding Your Top Profiles
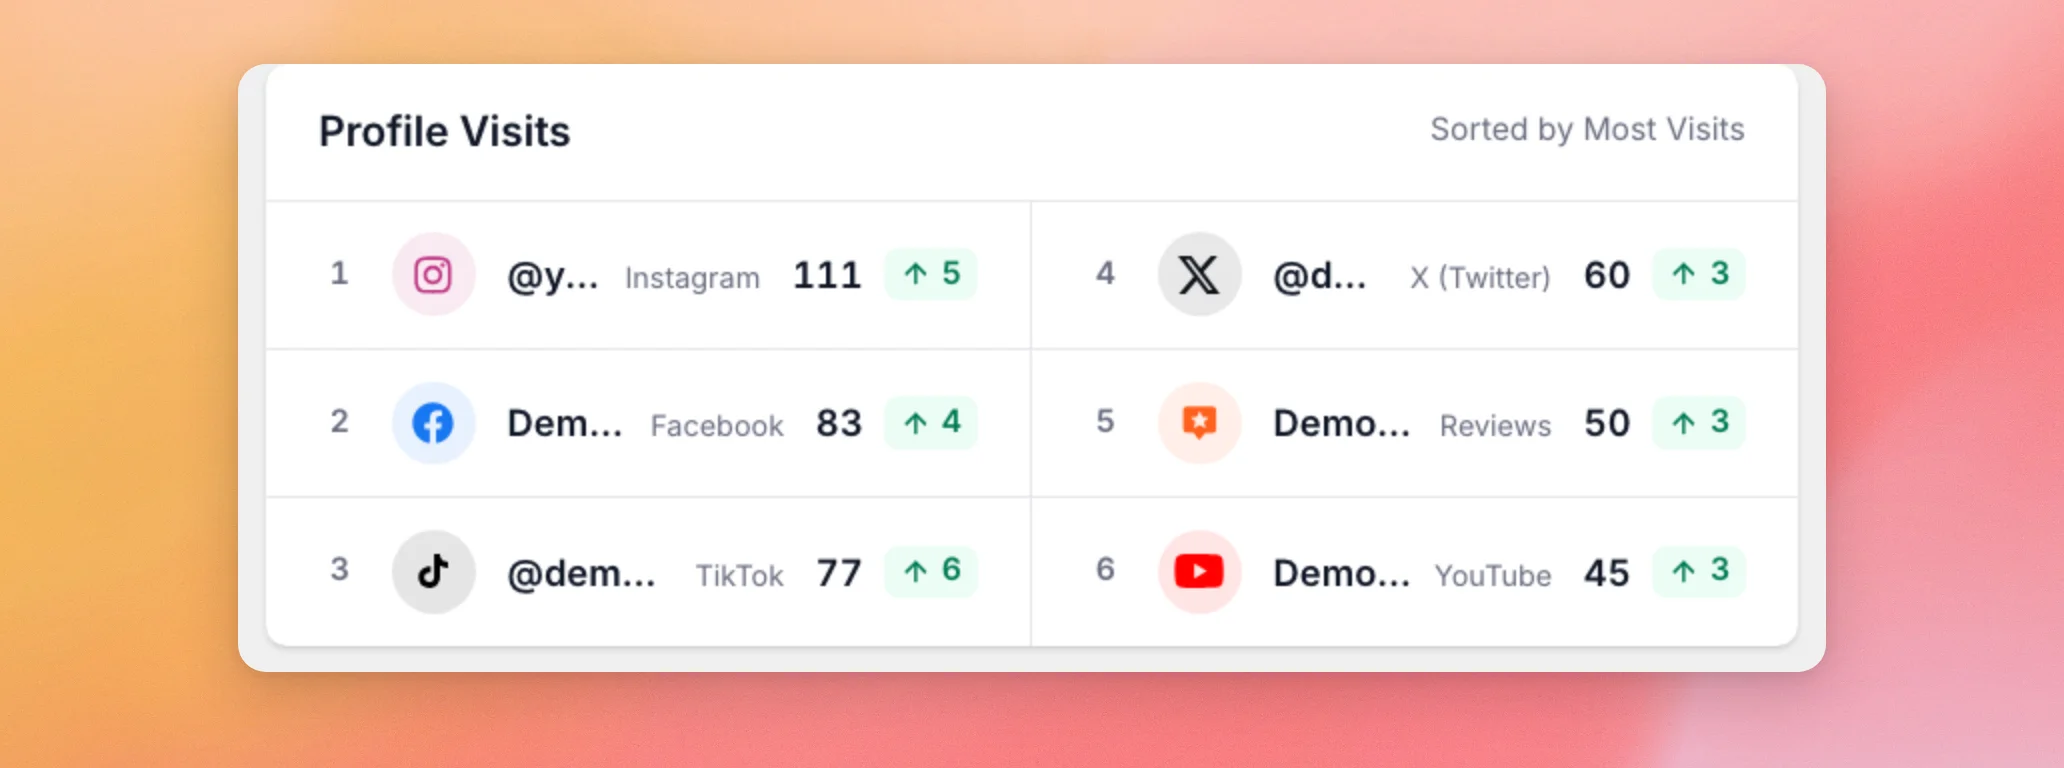
The Profile Visits card lists the profiles that received the most click-throughs, sorted from most to least. Each row shows a rank, the profile name, its platform, and the number of profile visits. The badge next to it compares that profile’s visits with the previous timeframe. A green number with an up arrow is how many more visits it got. A red number with a down arrow is how many fewer. A gray number means no change. The card shows up to 10 profiles.
Next, the Trend over time card shows how these numbers change across your timeframe.
Reading the Trend Over Time
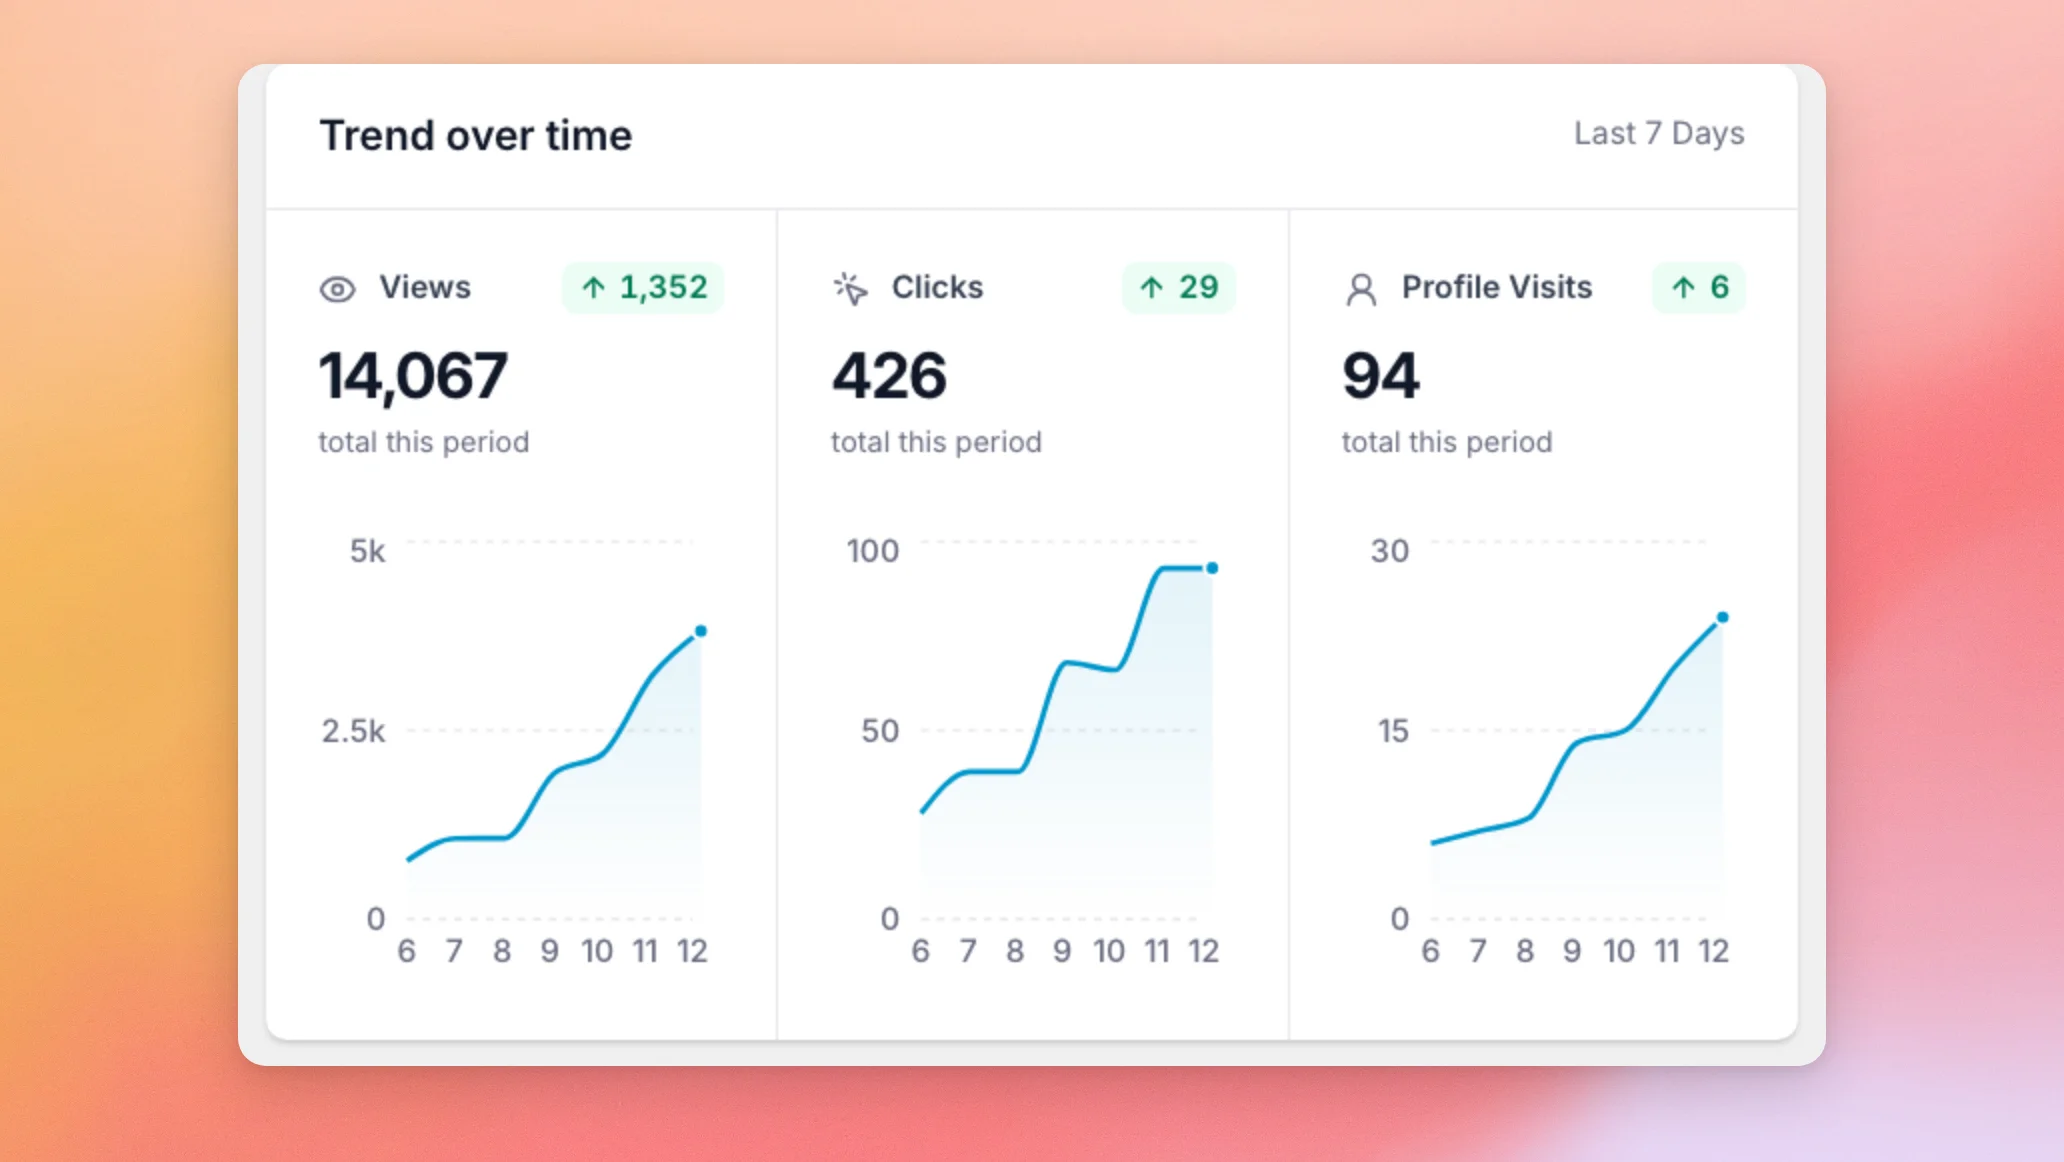
The Trend over time card has a chart each for Views, Clicks, and Profile Visits. Under each name, you see the total for the timeframe you picked.
The badge beside each name compares that total with the previous timeframe. The previous timeframe is the period of the same length that comes right before it. For example, with Last 7 Days selected, it compares against the 7 days before that. The badge shows the difference in the number of events, not a percentage. It is green with an up arrow when the total grew, red with a down arrow when it dropped, and gray when it stayed the same. That lets you see at a glance which way each number is moving.
The Top Posts card shows which posts visitors clicked the most.
Checking Your Top Posts
The Top Posts card ranks posts by clicks for the timeframe you picked, so you can see which posts attract the most attention. The list shows 5 posts at a time. Click a post to see its details on the right. The details include a chart of its views and clicks.
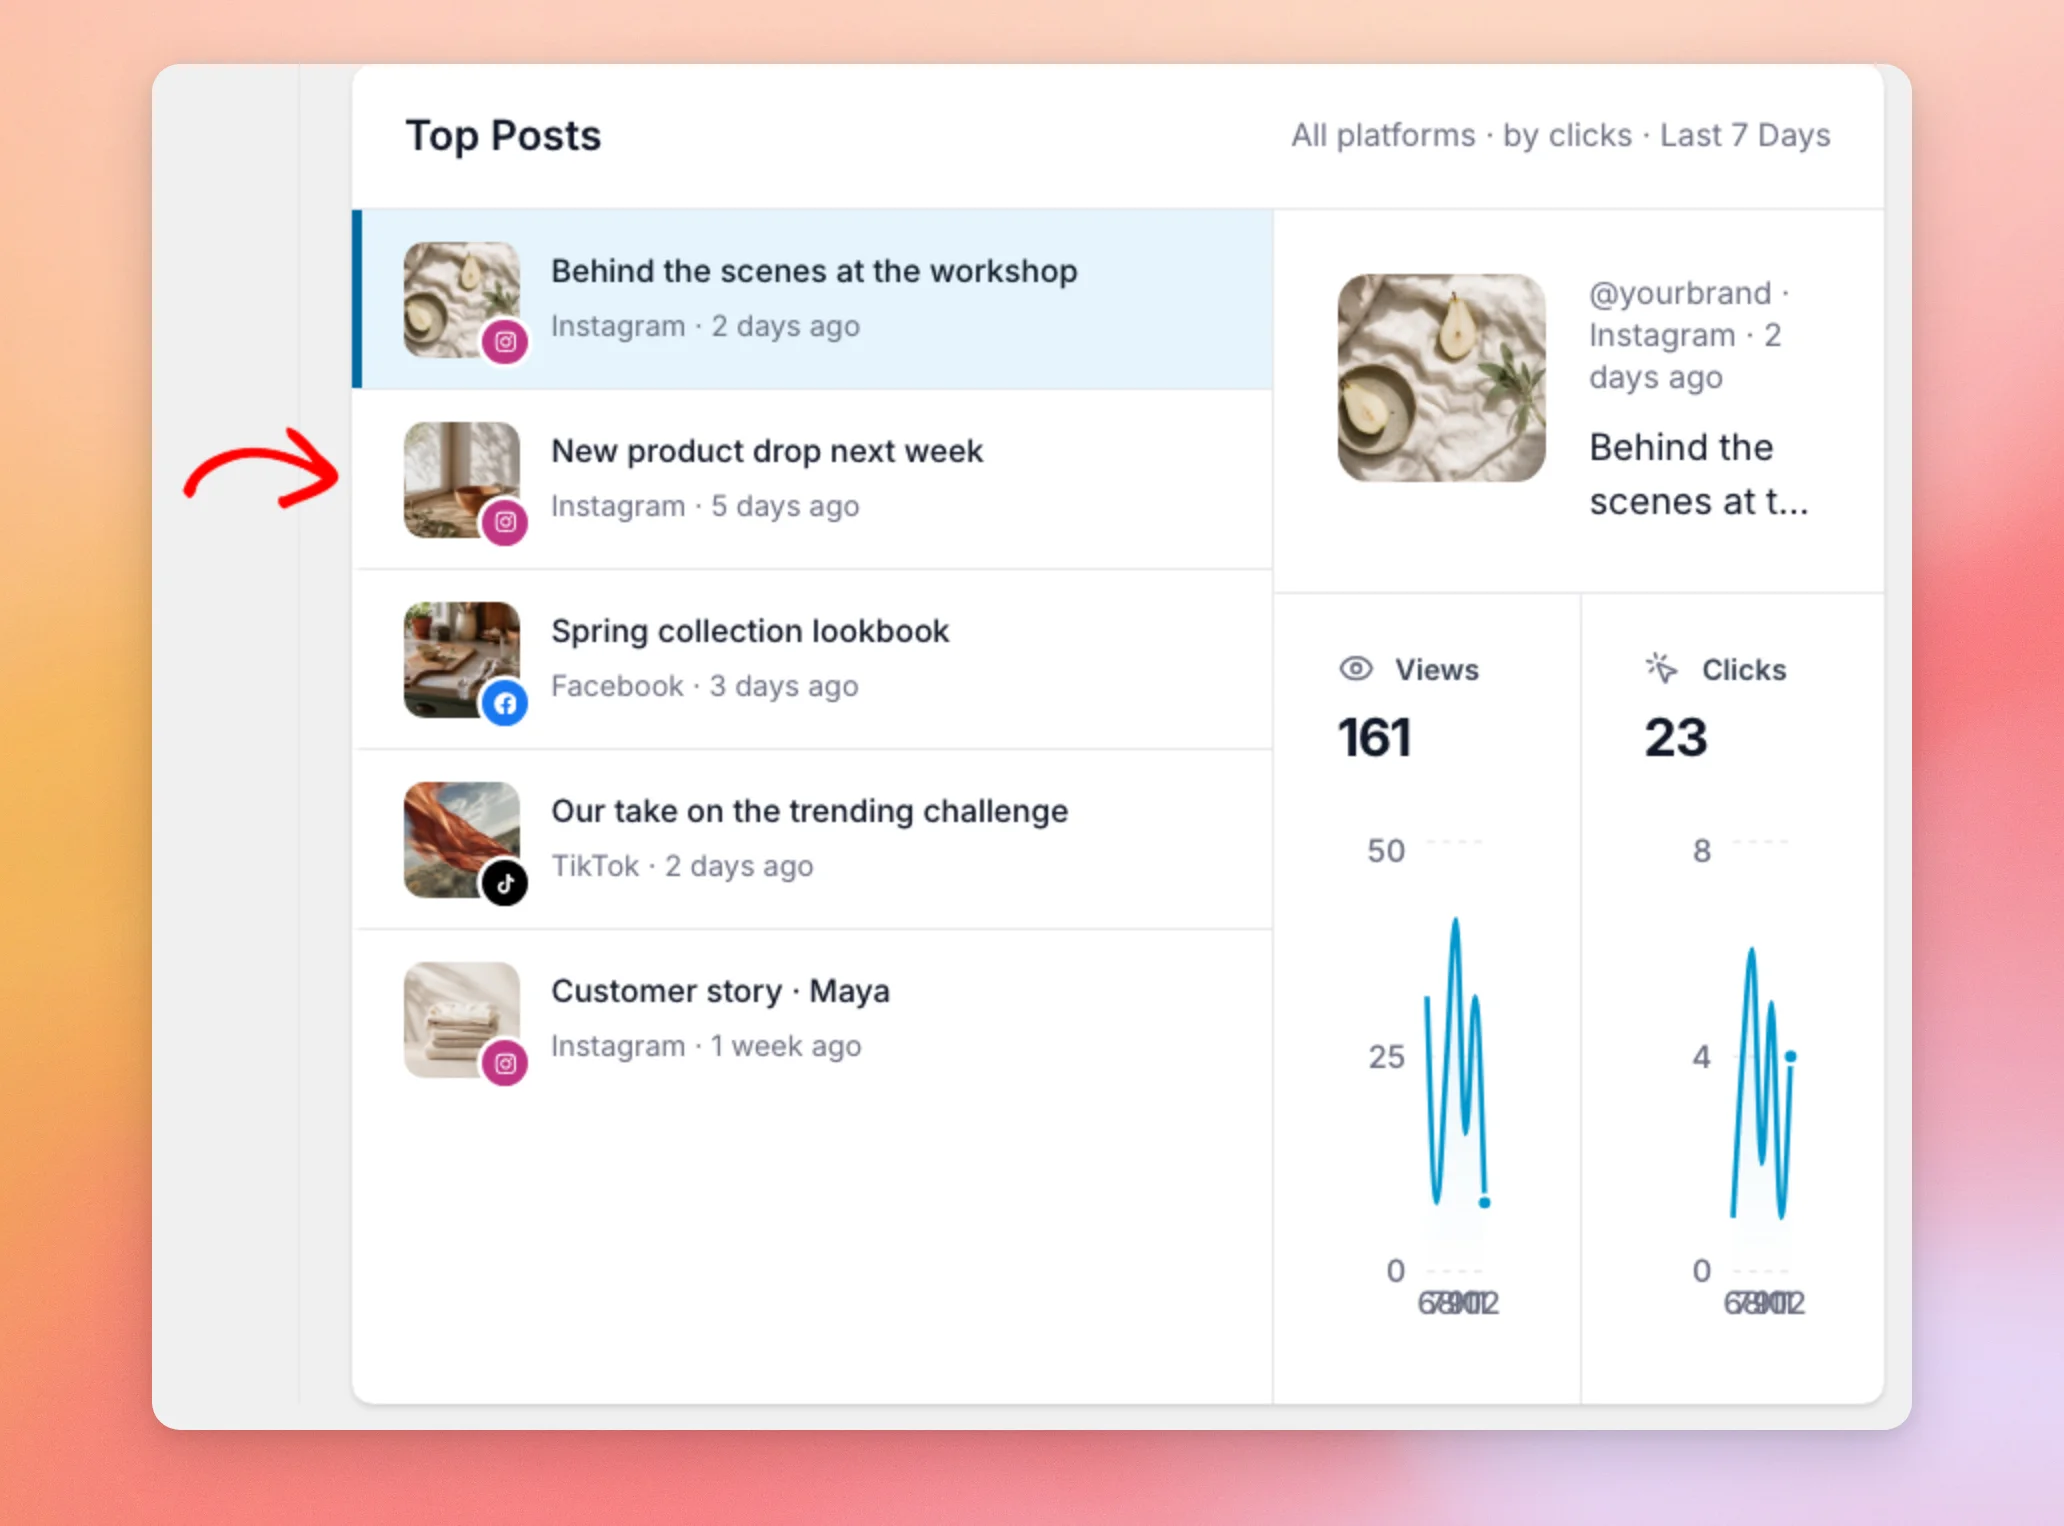
When more posts than the list shows have clicks, a Load more button appears under the list. It adds 5 more posts each time it is used. Sample data does not have extra posts. You only see the button once visitors have clicked more than 5 different posts in the timeframe you picked.
That covers every card on the main dashboard screen.
Viewing the WordPress Dashboard Widget
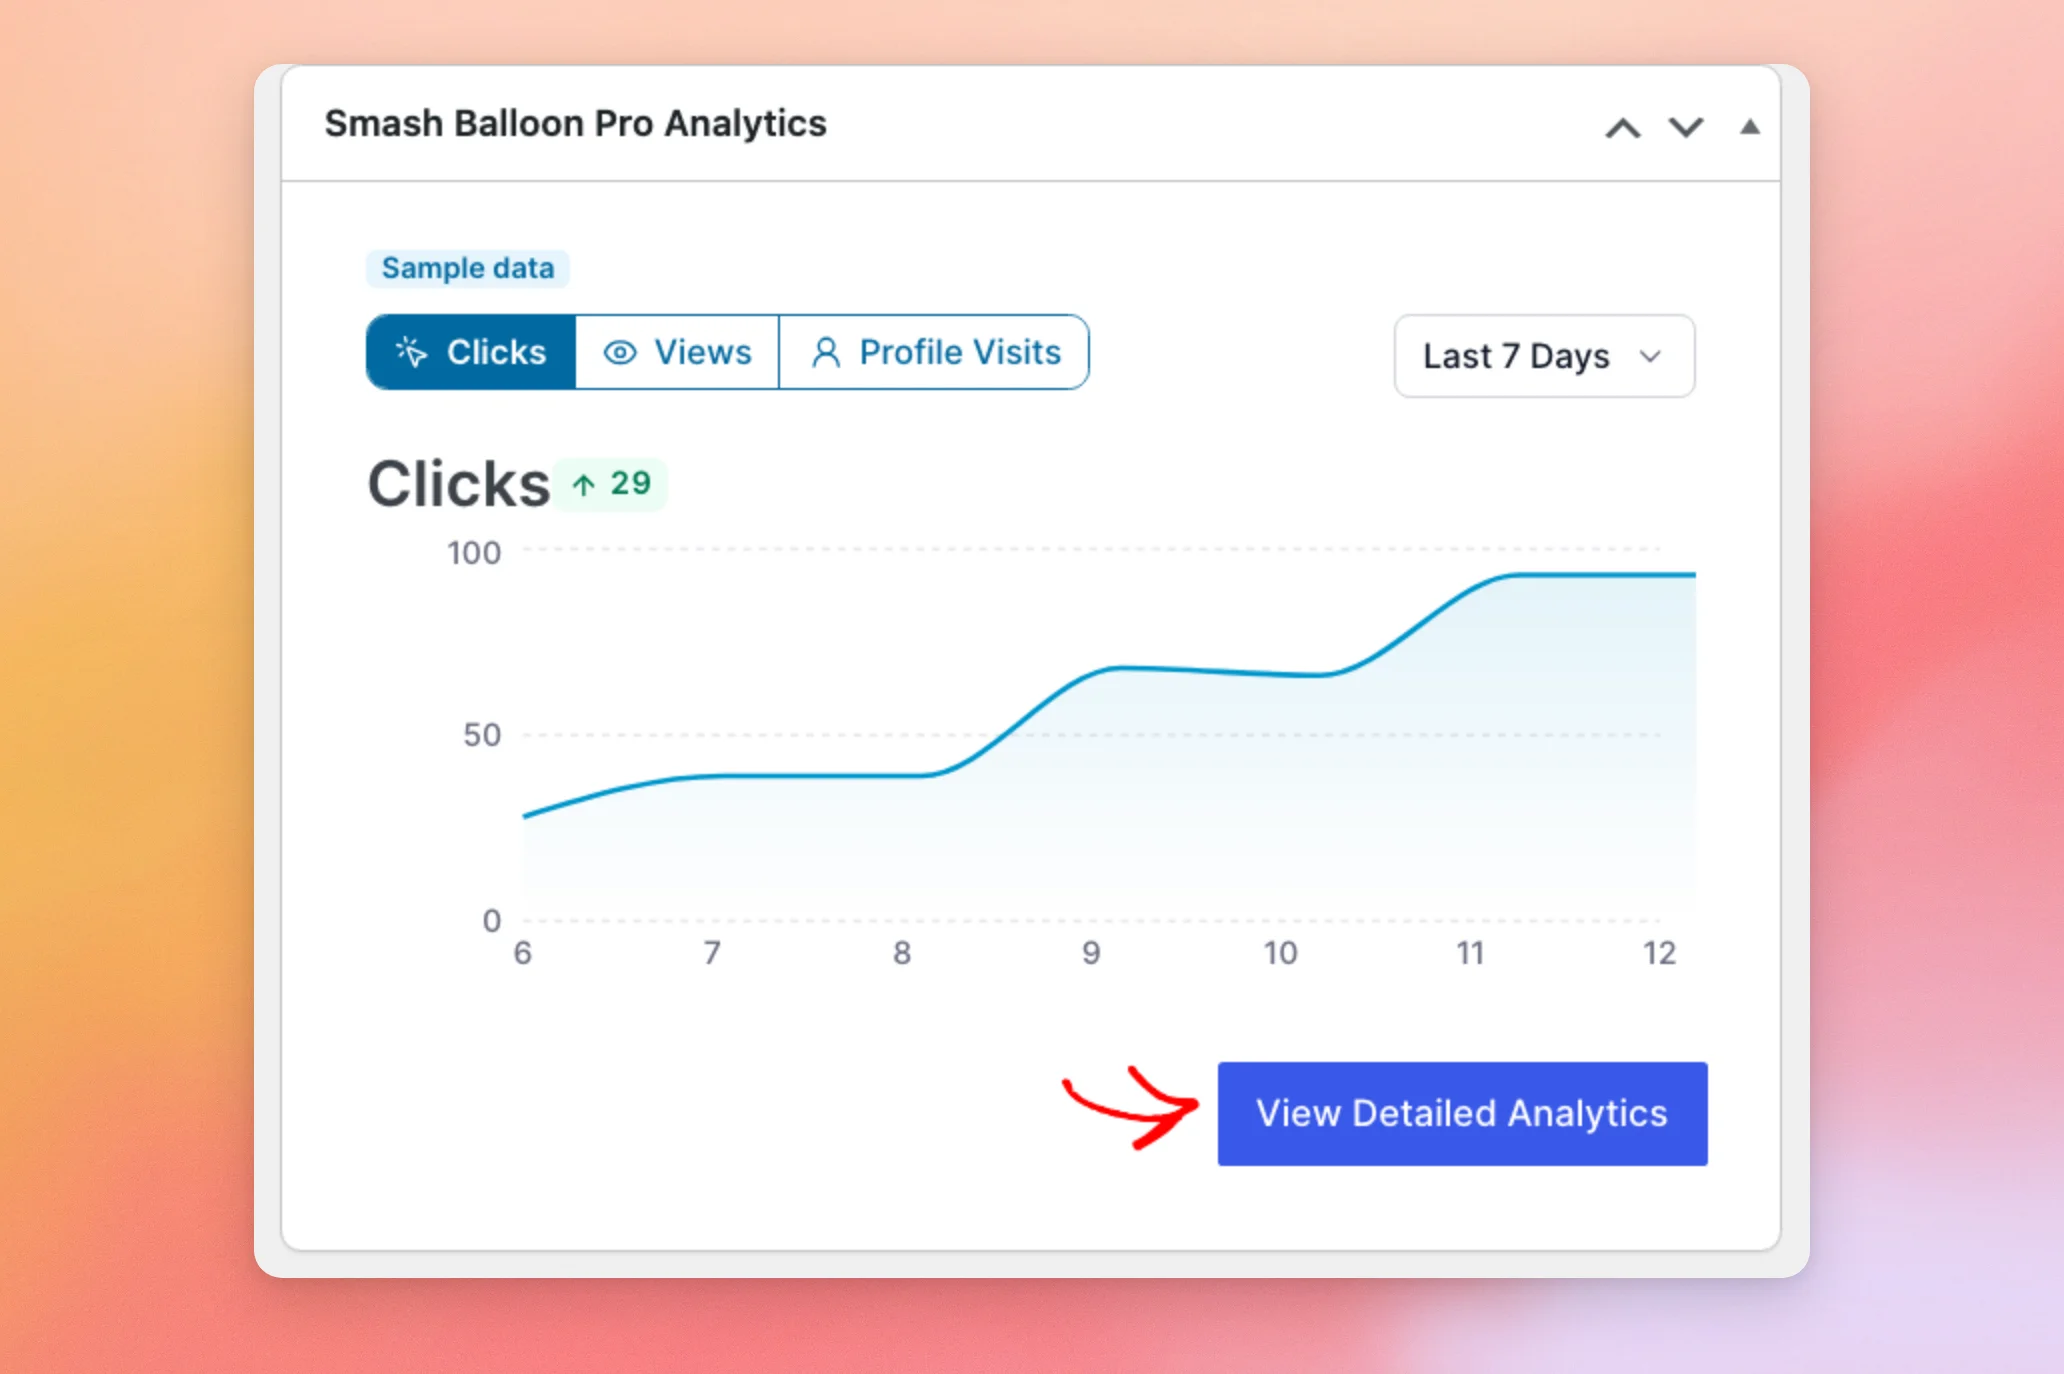
You can also get a quick look at your numbers without leaving the main WordPress screen. The Smash Balloon Pro Analytics widget sits on your WordPress Dashboard. It has a chart with tabs for Clicks, Views, and Profile Visits, and a timeframe menu.
To open the full dashboard described above, click View Detailed Analytics.
That’s it! You now know what each number on the Feed Analytics dashboard counts, from the User Journey to your Top Posts. Next, learn how to export these numbers in Exporting Your Feed Analytics Data.
Why do my numbers differ from Instagram, Facebook, or YouTube?
Feed Analytics counts what visitors do on your own website. The platforms count activity on their own apps and sites. The 2 sets of numbers measure different things and are not expected to match.
Why is a view counted only after 2 seconds?
A view is counted when at least 20% of your feed, or enough of it to fill half the screen, stays on screen for 2 seconds. A visitor scrolling past quickly does not add a view.
Why does my own activity not show in the report?
Feed Analytics ignores visits from administrators. Checking your feed while you are logged in as an administrator does not add to your numbers. To test it, open the page in a private window. See Troubleshooting Feed Analytics When No Data Shows.
Can I export these numbers?
Yes. See the Filtering by Feed and Timeframe section above for where the Export button sits, and Exporting Your Feed Analytics Data for how to use it.